

Tag: ohsome
-
Exploring the Value of Microsoft ML Roads for OSM Data Quality Analysis
The completeness of the OpenStreetMap (OSM) road network has been an ongoing focus for researchers for more than 15 years. For instance, Neis et al. (2011) investigated the OSM street network evolution in Germany and compared it against road data from TomTom. Whereas obtaining reference data has been rather difficult in the past, nowadays we…
-
Version 1.0 of the ohsome quality API and ohsome dashboard
At HeiGIT and in particular within the ohsome team, we strive to provide valuable insights into OpenStreetMap (OSM) data. The ohsome API offers aggregated statistics on the evolution of OSM elements since 2020. These are made easily accessible by the ohsome dashboard. With the ohsome quality API, previously called ohsome quality analyst (OQT), we continue…
-
Taginfo goes ohsome
Did you know that the OpenStreetMap (OSM) taginfo site now lets you access the ohsome dashboard? This allows you to gain refined insights into the usage stats of specific keys and tags. Taginfo is the main source for statistics about keys, tags and current tag usage. In most cases, you have to acces a localized…
-
Visualizing OQT API Results in QGIS
Using the ohsome dashboard, it is possible to explore quality estimation for OpenStreetMap (OSM) data from the ohsome quality analyst (OQT) for arbitrary regions. Also, OQT does provide an API to programmatically fetch quality estimation for a lot of different regions in one request. Chances are that one wants to visualize the results on a…
-

Introducing ohsomeNow stats: Real-Time Monitoring for OpenStreetMap Contributions
You can now monitor contributions to OpenStreetMap (OSM) in real time with ohsomeNow stats! We developed this new dashboard as part of our long-term cooperation with the Humanitarian OpenStreetMap Team (HOT), an international organization dedicated to humanitarian action and community development through open mapping. This dashboard replaces the Missing Maps Leaderboard with a comprehensive overview of…
-
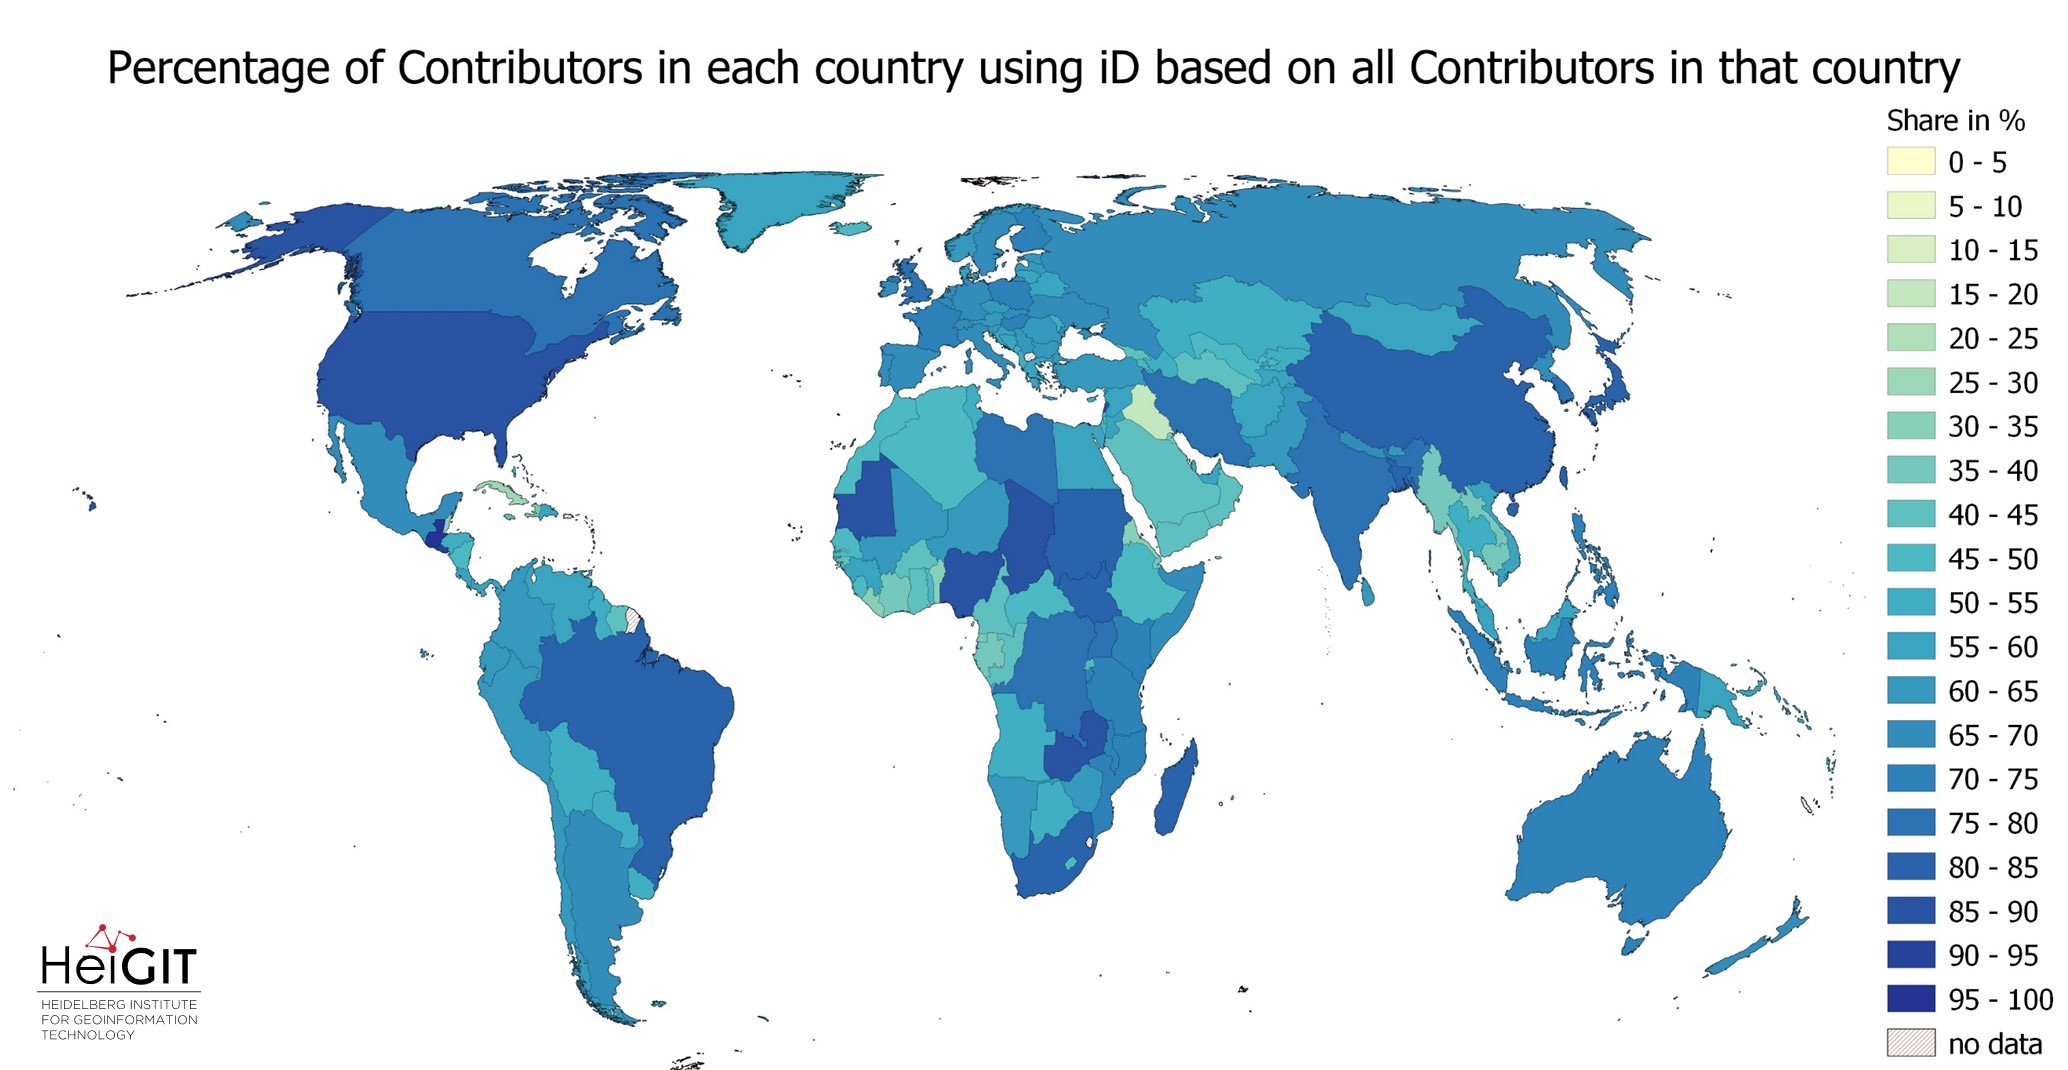
Exploring OSM editor statistics by combining data from OSHDB and changeset DB
OpenStreetMap (OSM) marks one of the most successful and powerful open source, crowdsourced geomaps, with over 10 million registered users by 2023. Since 2008 this number has increased steadily. In this blog post we want to look behind this success from the perspective of editing software used to add, modify and delete data in OSM.…
-
Integration of OQT into the ohsome dashboard: Computing data quality metrics for OpenStreetMap
The ohsome dashboard has been and continues to be an easy access point to generate accurate statistics about the historical development of OpenStreetMap data for arbitrary regions. Now, the ohsome dashboard got extended to be able to compute data quality metrics for OpenStreetMap through the ohsome quality analyst (OQT) which is also developed by HeiGIT. The source code is now…
-
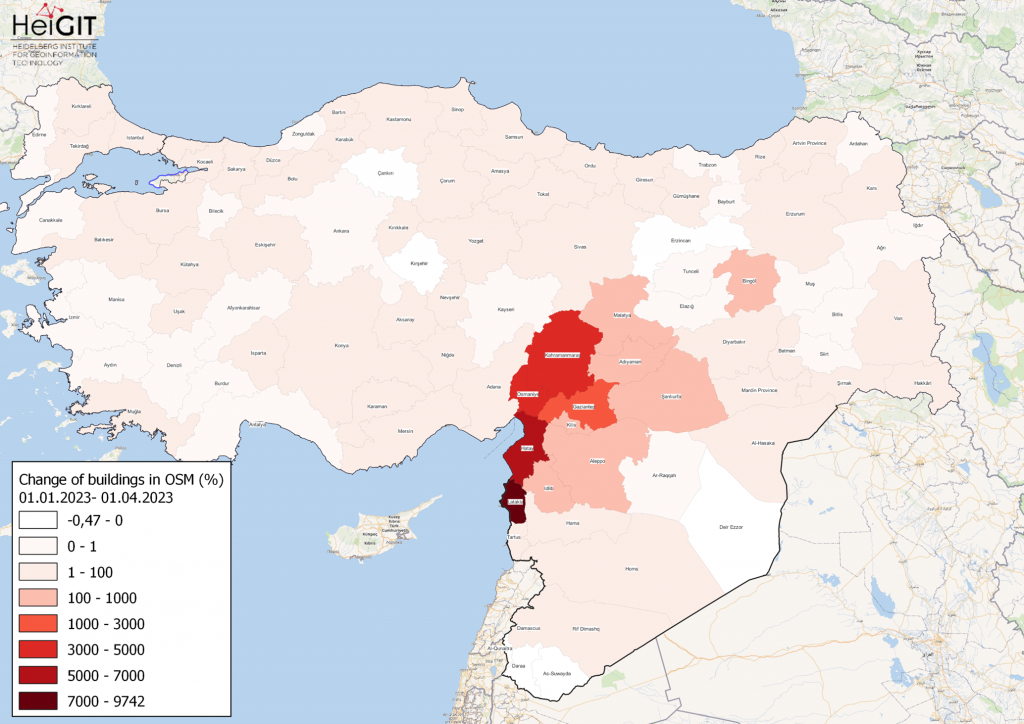
How to become ohsome part 15- Analysing Changes in OSM after the Earthquake in Syria and Türkiye in February 2023
Featured Map: Percent change in each province of Türkiye and Syria of buildings in OSM. Data from OpenStreetMap, visualized using QGIS and the ohsome API plugin. Welcome back to the how to become ohsome series! If you’re new to the series, you can check out the previous issues (like this one) or the ohsome Region of…
-
OSHDB Version 1.0 Has Arrived
Featured Photo: Ohsome dashboard interface for Heidelberg, Germany. In the words of Confucius, “The man who moves a mountain begins by carrying away small stones.” As we release OSHDB (OpenStreetMap History Database) Version 1.0, we look back at versions 0.5, 0.6, 0.7, and all the other small improvements to our historical OpenStreetMap database as the…
-
Job Opening for Postdoc / Senior Researcher on OpenStreetMap Road Quality Analysis
If you’re on the job market or know someone who is, check out this exciting new opening at GIScience. The offer is included as text below! You are interested in enhancing methods for analyzing & improving OpenStreetMap data? You are an experienced Spatial Data Scientist innovating geoinformatics methods & workflows? You have profound hands-on experience…
-
Time to celebrate! oshdb has reached an object count of >10 billion!
As of 02.11.2022 we have reached objects 10,107,826,483* in our oshdb. As such, we think it is most definitely time to celebrate! *For information on the background this figure, read our Basic guide to OSM data filtering 😉 This blog post is all about reaching 10 billion objects in OpenStreetMap. For the database to aggregate such…
-
Near realtime OpenStreetMap data and stats: OSHDB and ohsome API are now updated hourly
We have exciting ohsome news! As many of you know, past OSHDB updates happened weekly and led to a delay between the data in OpenStreetMap (OSM) and our database. Basically, you had to wait up to a week to see changes in OSM reflected in the OSHDB. From this point forward, that lag is a…