

You can now monitor contributions to OpenStreetMap (OSM) in real time with ohsomeNow stats! We developed this new dashboard as part of our long-term cooperation with the Humanitarian OpenStreetMap Team (HOT), an international organization dedicated to humanitarian action and community development through open mapping. This dashboard replaces the Missing Maps Leaderboard with a comprehensive overview of how much mapping takes place at certain mapping events and campaigns – and thus can motivate mappers to be even more active!
With ohsomeNow stats, you gain access to up-to-date and global-scale statistics on mapping activity within OSM. The dashboard offers valuable insights, including the number of contributors, total map edits, added buildings, and road length for a specified time range and OSM Changesets hashtag filter. What sets ohsomeNow stats apart is its quick update feature. Every edit made to OSM is instantly reflected on the dashboard, just a few minutes after it happens. This is a huge progress since up to now, these numbers occasionally happened to be delayed and therefore were not always reliable. Now, with ohsomeNow stats, we take this to a whole new level, offering a wealth of detailed and reliable information. And this is just the beginning!
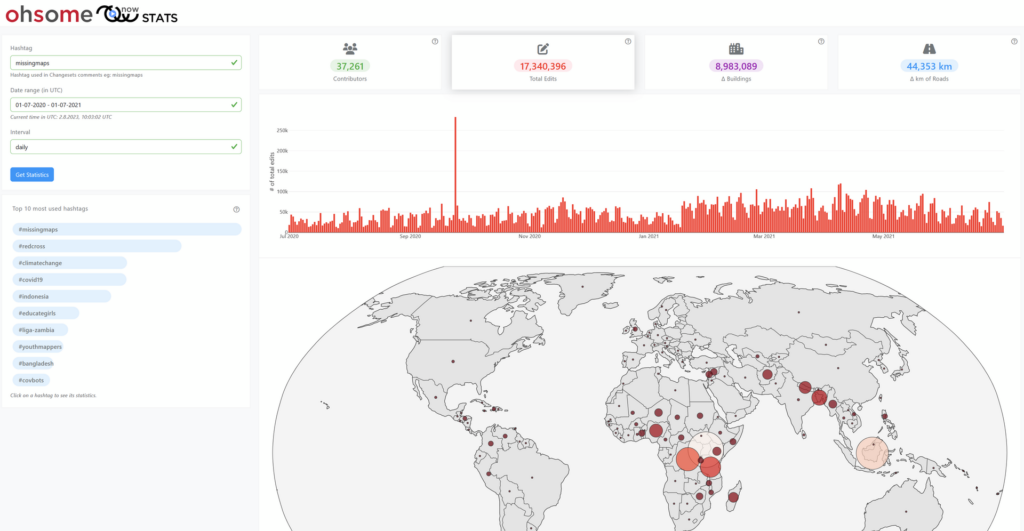
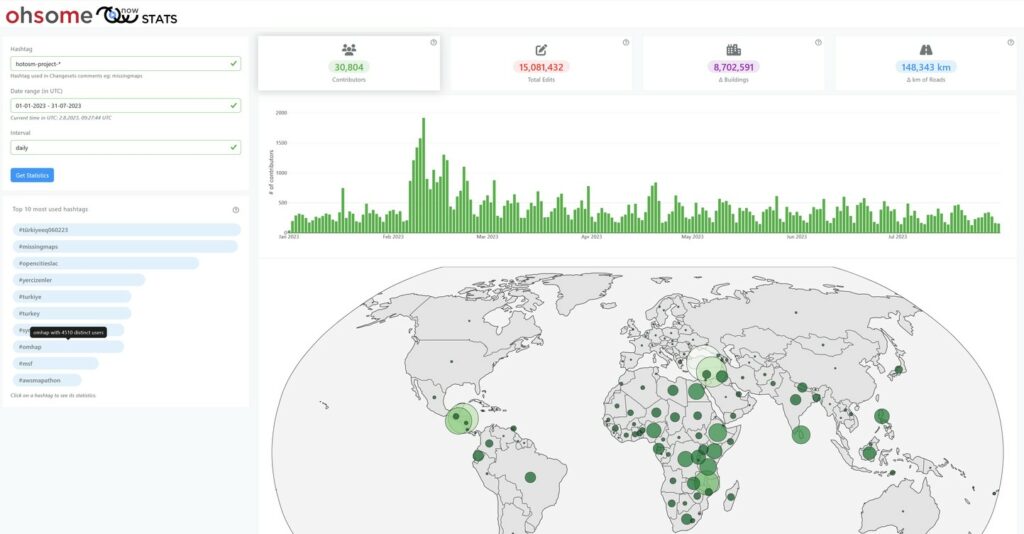
This is what the new ohsomeNow stats dashboard looks like: In the left-hand corner you can see the customizable hashtag, time frame and time interval selection. Beneath, the ten most frequently used hashtags are listed. At the top, the stats for the selected hashtag and time frame are being displayed (here currently #missingmaps). Underneath, the timeline shows the total map edits (red) to the selected hashtag, while at the bottom, you can see for which countries the edits have been made. By clicking on the general stats at the top, you can also see the contributed buildings, roads and the number of contributors.
These are the new features that ohsomeNow stats offers
- Overview Statistics: The overview statistics provide numbers about mapping activity for the hashtag and the time range defined in your query. Currently, we do report on the number of contributors (green), total edits (red), buildings (purple), and km of roads (blue).
- Trending Hashtags Chart: You can now see the most frequently used mapping hashtags in your chosen time intervals! Since mapping events and campaigns mostly use unique hashtags, they can individually be tracked and analyzed. This means, that it is now possible to measure the success of individual mapathons in real time! You can click on one of these trending hashtags, and it will adjust your dashboard to show detailed stats.
- Country Map: You can see the number of contributors as well as the contributed number of buildings, km of roads, and total map edits per country – nicely displayed by an interactive world map.
- Timeline Plot: A timeline shows how the mapping for certain hashtags evolved over time in individually selected time intervals. For example, hourly intervals can show the effectiveness of single mapathons, while larger intervals of several days or even months can give information about the success of long-term mapping campaigns.
Let’s look at some examples of what you can do with these new functions:
Example 1
You can find out how many buildings and roads have been added during a mapathon. Here we use the example of the German Red Cross which regularly hosts online and in-person mapathons and uses #MissingMaps_DRK for their mapping. You can nicely see the latest spike resulting from their effort on July 19 when 31 contributors joined their mapathon.
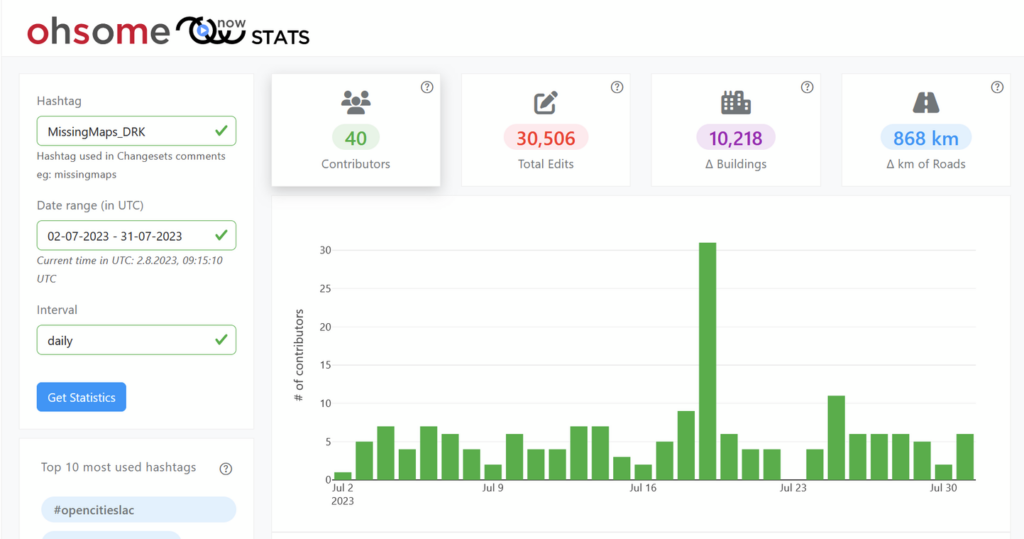
The ohsomeNow stats dashboard, showing a spike in contributors for the hashtag “#MissingMaps_DRK” on July 19, resulting from a German Red Cross mapping campaign.
Example 2
The German Red Cross and HeiGIT are part of the Missing Maps project. So let’s check the number of people who have mapped something in OSM for Missing Maps since 2014. “#missingmaps” is the most used hashtag in the OSM ecosystem. Up until now, more than 150,000 mappers have added over 58.5 million buildings in OSM.
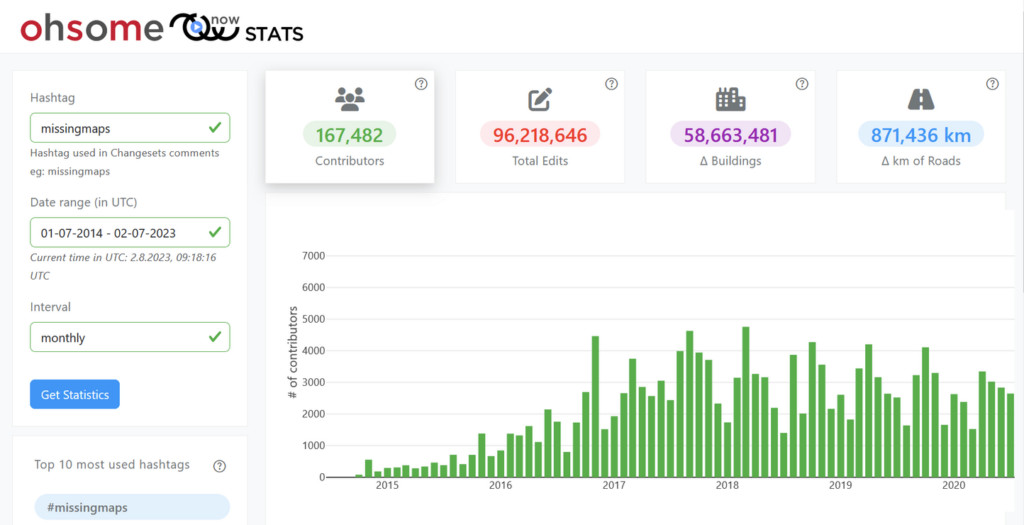
The dashboard shows that more than 150,000 mappers have added over 58.5 million buildings in OSM, using #missingmaps.
Example 3
Did you know that every year there is a lot of mapping going on during the OSM Geography Awareness Week? In our stats, you can see that in total more than 14,000 mappers took part over the past years, using the hashtag “#osmgeoweek”. You also clearly see when it happens: Usually in November each year.
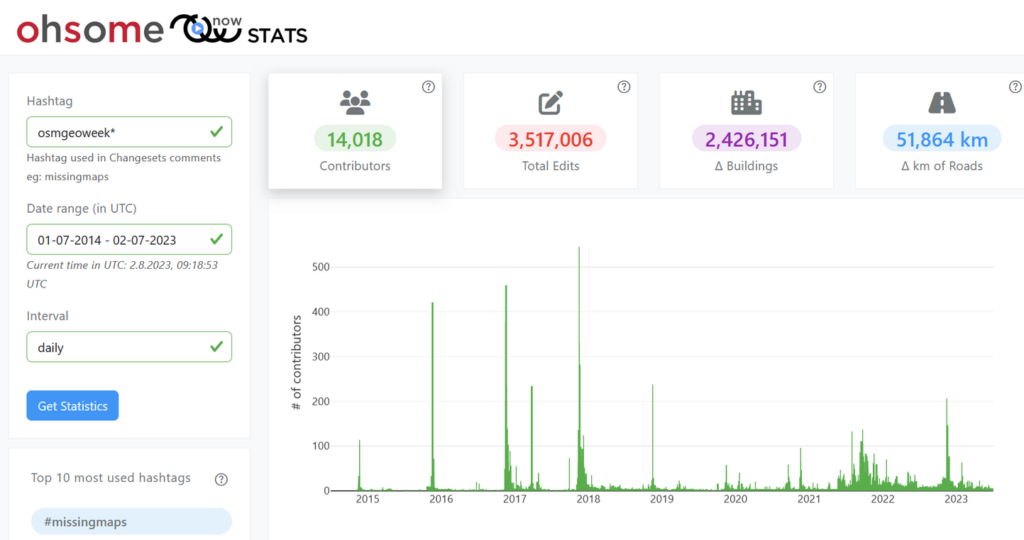
The spikes in the timeline show the high mapping activity during the OSM Geography Awareness Week.
Example 4
The dashboard will also tell you how much mapping has happened through the HOT’s Tasking Manager in the past year. Here you can clearly see the mapping efforts after the Turkey/Syria Earthquake in February 2023, which we have also investigated in another blogpost in more detail:
The screenshot shows the high mapping activity during the earth quake in Syria and Türkiye this February.
What comes next?
The roll-out of the new dashboard is only the beginning of several modernizations and improvements! In the week of August 21, the HOT Tasking Manager stats will be switched to the new API. The respective pages on the Missing Maps Leaderboard and the user profiles will not be available anymore by then. The HOT Tasking Manager User Stats will not be affected by this. By the end of August, the old stats API will be shut down by the HOT Tech Team, so make sure you use ohsomeNow stats by then!
Please get in contact with us (ohsome@heigit.org) in case you have embedded the old OSM-stats API in your services or website, or if you have any related questions.