

Using the ohsome dashboard, it is possible to explore quality estimation for OpenStreetMap (OSM) data from the ohsome quality analyst (OQT) for arbitrary regions. Also, OQT does provide an API to programmatically fetch quality estimation for a lot of different regions in one request. Chances are that one wants to visualize the results on a map. This post shows how to create such a map in QGIS.
You are welcome to follow along the described steps. To do so, either make a request to the OQT API for your area of interest or download the same result GeoJSON as it is used in this article.
Based on the request accept header, the OQT API response format is either JSON or GeoJSON. The GeoJSON geometry of the result is the same as the input geometry. The properties of the GeoJSON Fetures contain the quality estimation. Because the properties are a JSON object, QGIS does not recognize the fields as attributes immediately. Instead, there are three JSON objects in the attribute table: metadata, topic and result. Each of these objects contains further key-value pairs, for example, the label key exists within the result object. The value of the label key indicates the quality of the OSM data for the respective feature using traffic light colors. Thus, the label value can be used to color features based on the quality estimation.
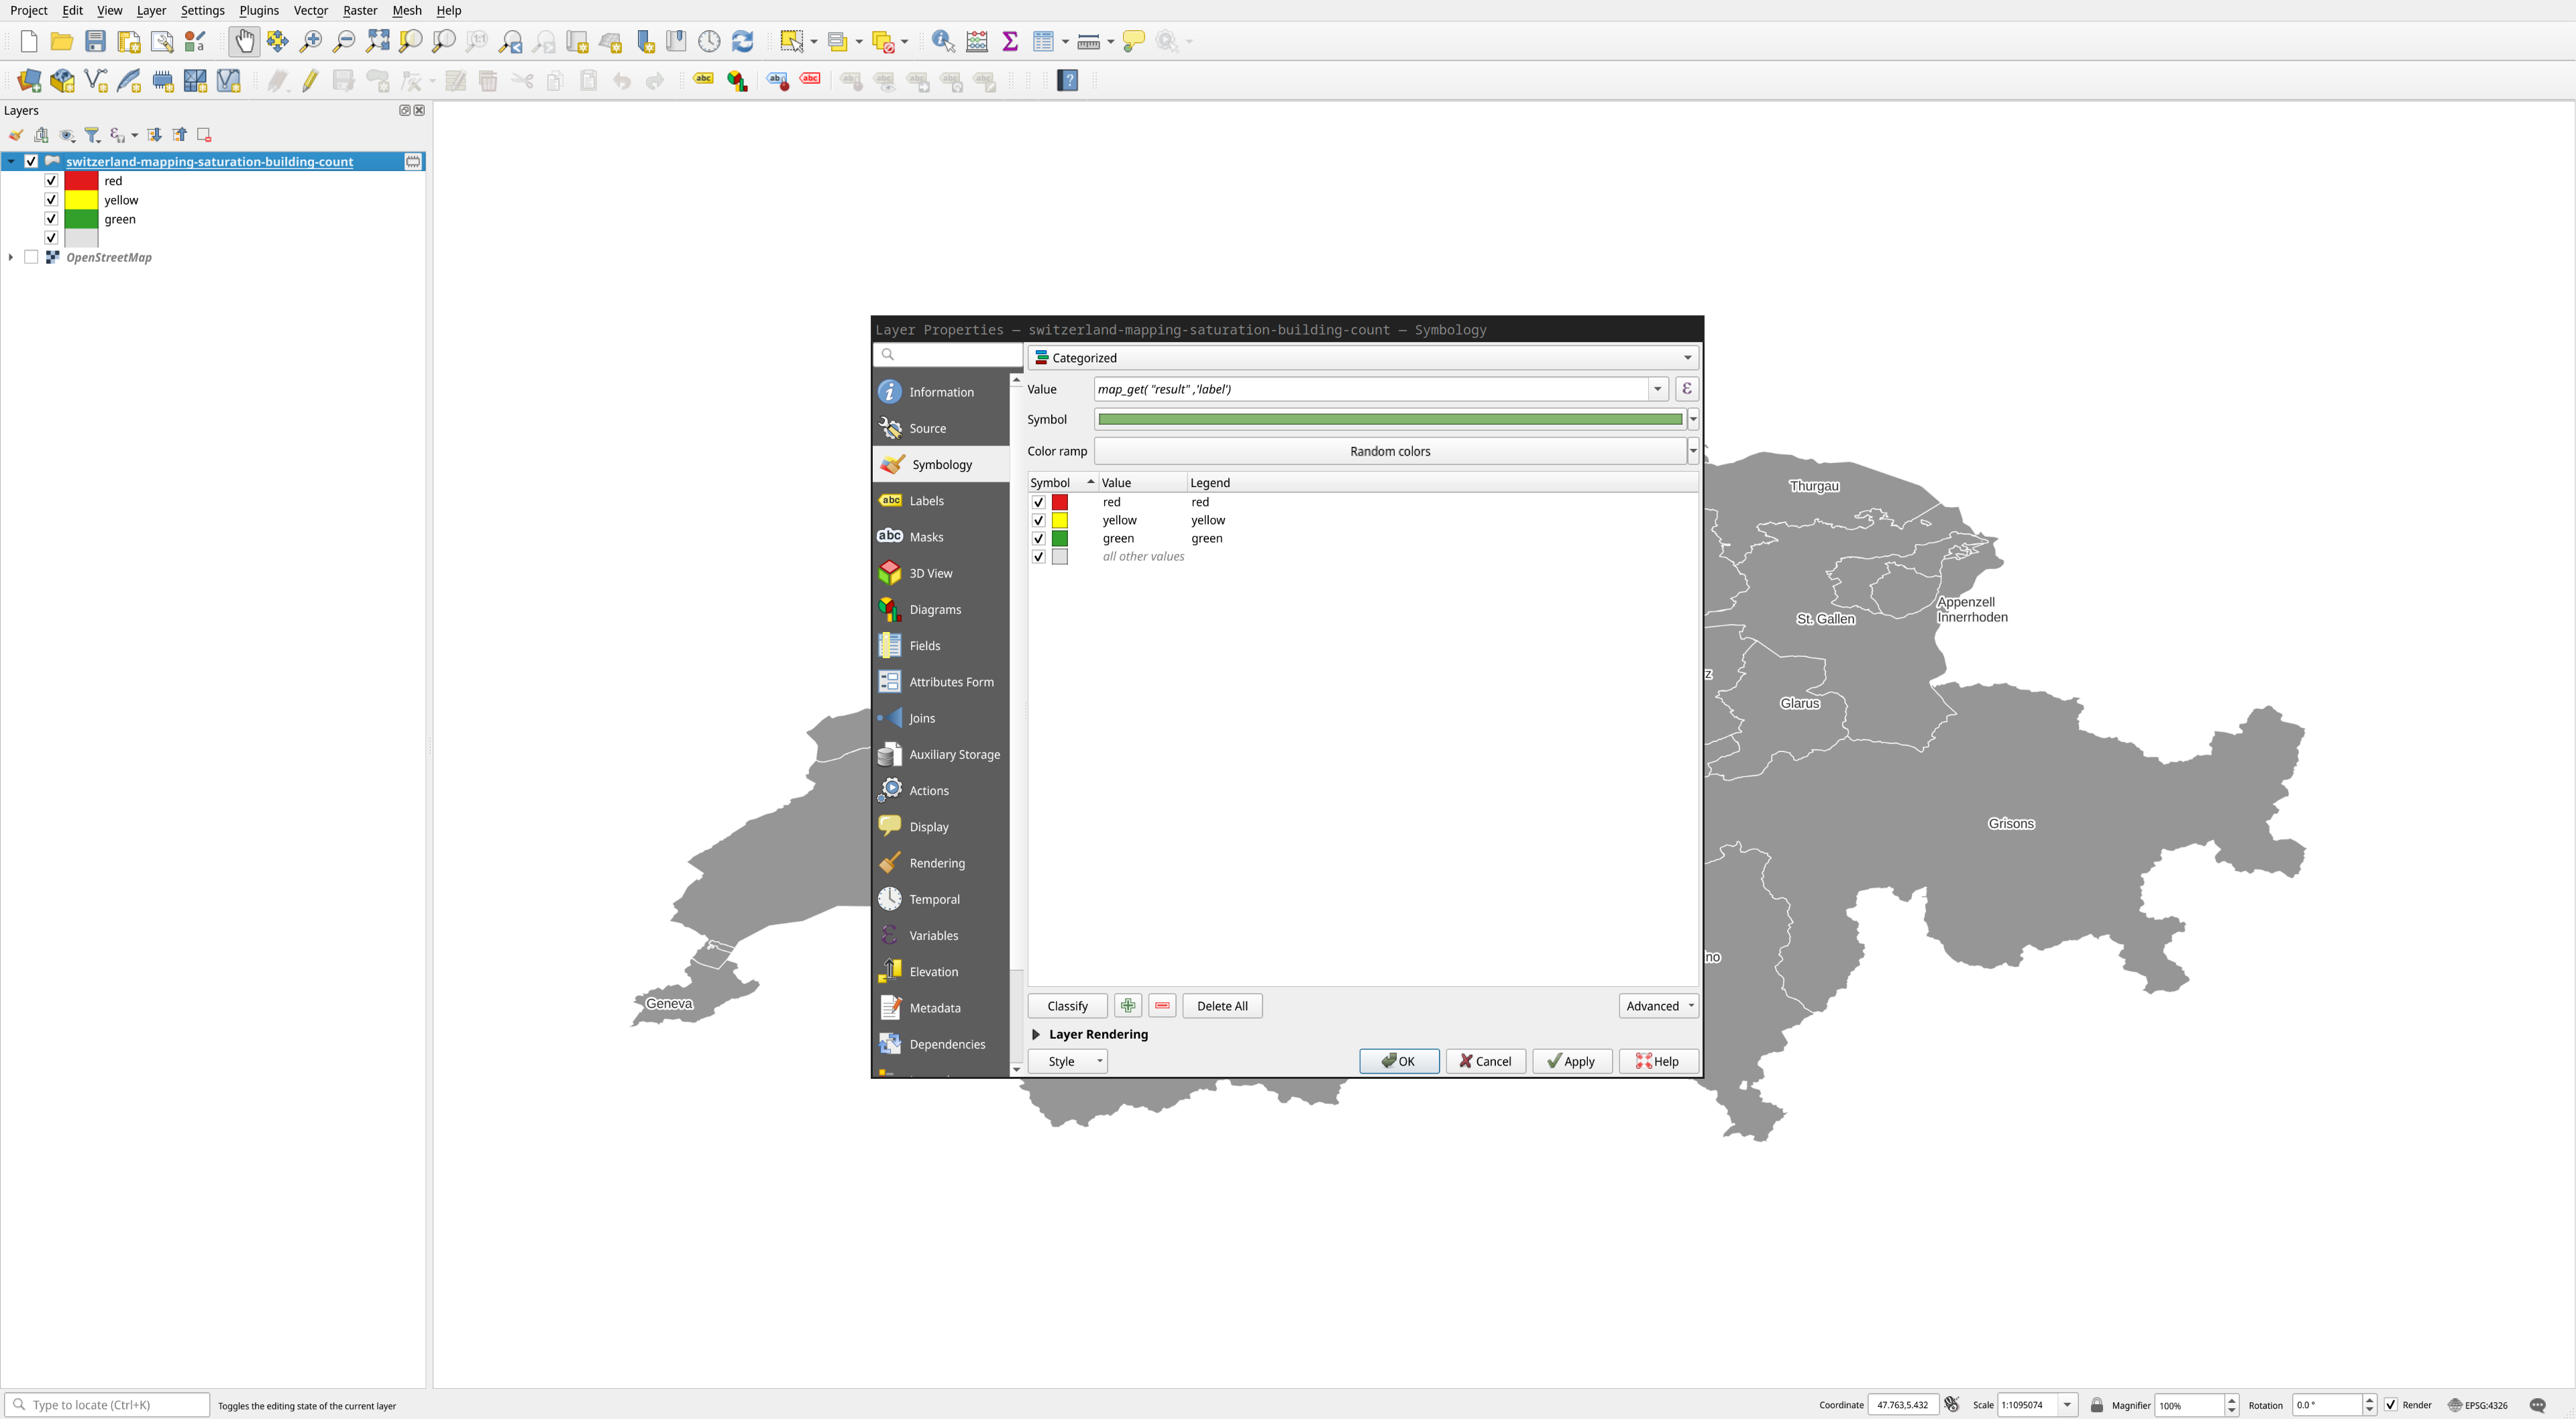
Using an expression instead of an attribute table column, it is possible to access the label value. To do this, open the properties of the layer and select the Symbology tab. After selecting the type of visualization (e.g. ‘Categorized’ or ‘Graduated’), insert the following expression in the ‘Value’ line:
map_get("result", 'label')
Now, QGIS recognizes the values, and you can let QGIS do the classification by clicking on ‘Classify’.
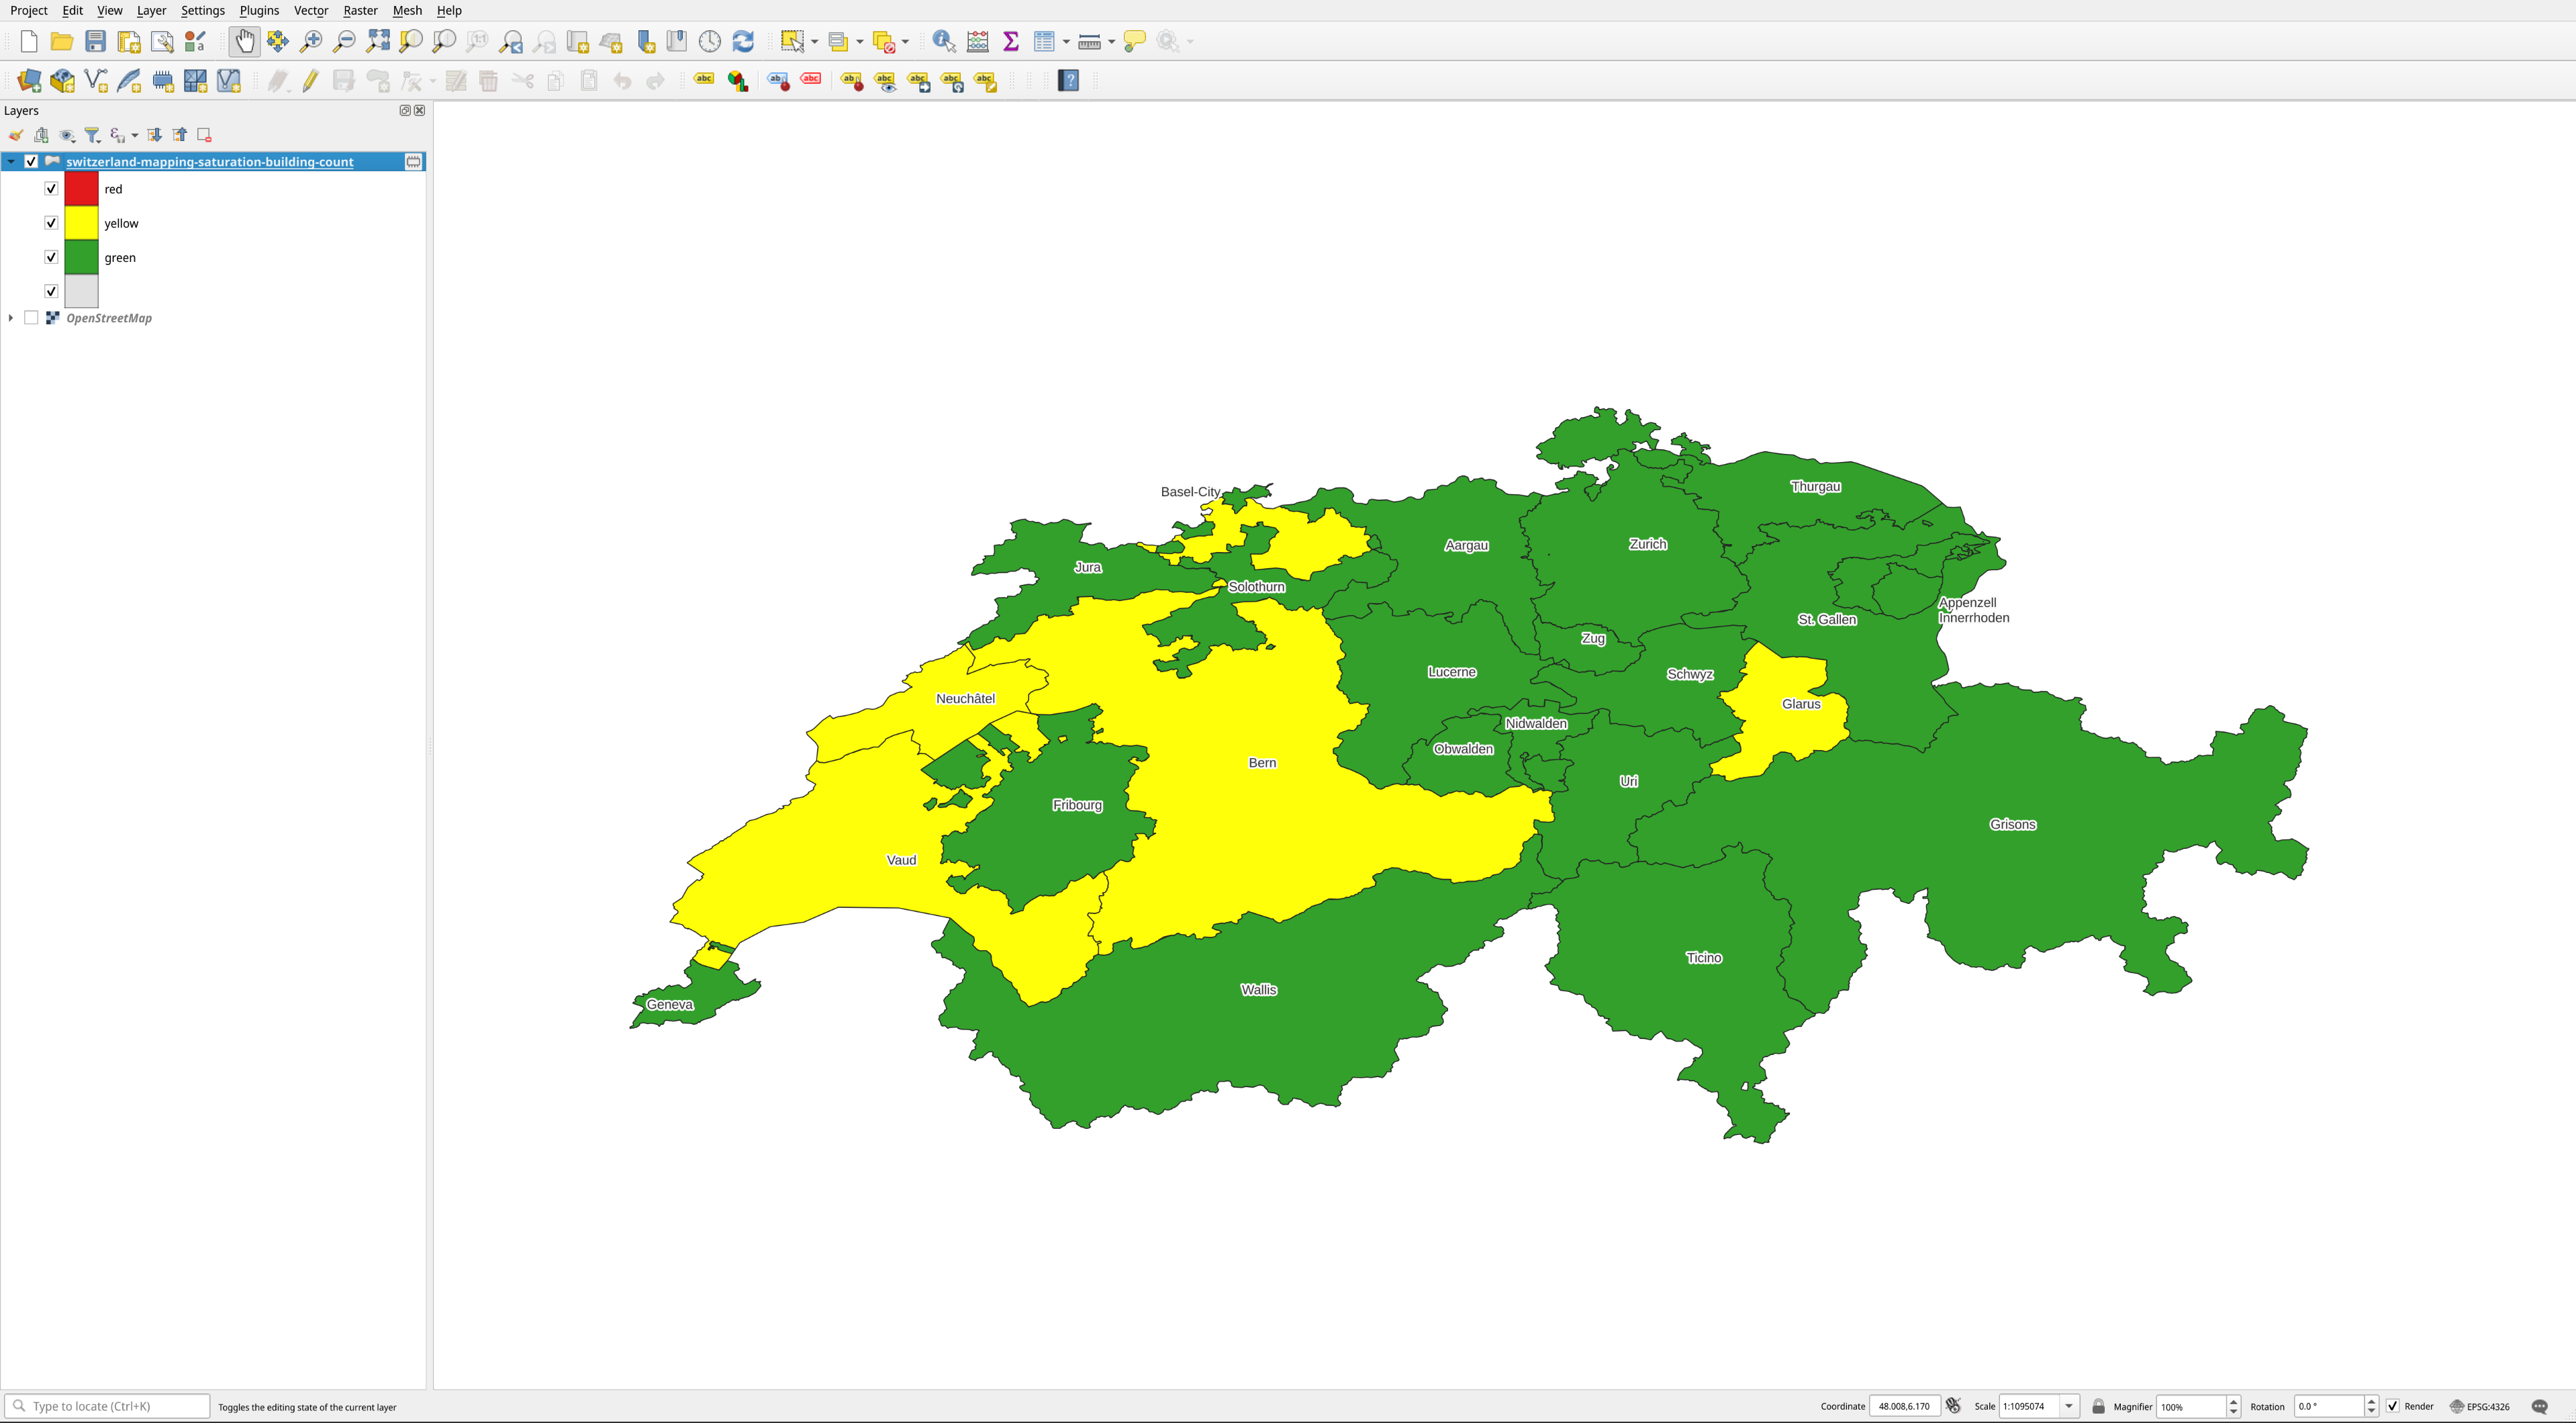
Pressing ‘OK’, QGIS visualizes the areas according to the OQT quality labels, allowing one to easily get an overview of the OSM data quality in different areas.
To make this process easier, we provide a QGIS style file. Simply load the GeoJSON result from the API into QGIS, open the layer properties, select the symbology tab, and click the style button on the bottom left to select our QGIS style file. It visualizes the polygons based on the label with the expression described above.
Thanks for following along this guide. You are welcome to send us any feedback via GitHub issues or E-Mail (ohsome@heigit.org).