

OpenStreetMap (OSM) marks one of the most successful and powerful open source, crowdsourced geomaps, with over 10 million registered users by 2023. Since 2008 this number has increased steadily. In this blog post we want to look behind this success from the perspective of editing software used to add, modify and delete data in OSM.
The official OSM Stats Wiki lists a number of different statistics on the User base of OSM. The Editor usage stats wiki gives detailed statistics on the different editing software used by OSM contributors. Another excellent example is https://piebro.github.io/openstreetmap-statistics/#c229 with detailed statistics on a monthly basis since 2009 which are being updated regularly.
At HeiGIT we are constantly working on new and efficient ways to analyse OSM history data in order to understand if OSM data is “good enough” for various use cases. So far our OSHDB and ohsome API have provided access to all information related to OSM elements, but did not contain information related to the editing software used for mapping. By combining data from OSHDB and the OSM changeset database we now produced an “enriched” and much more comprehensive dataset. This dataset allows us to easily investigate the number of edits, active contributors and the editing software that was used for mapping in OSM.
So let’s reproduce some of the OSM editor statistics for the years 2018-2023! 🙂
The next parts of the blog post will be covering the following issues:
The Baseline:
- Number of Edits
- Active Contributors
Temporal evolution of editor statistics for 2018 – 2023
- The top 5 editing software with the most active contributors and edits since 2018
Detailed view on editor statistics for 2022
- The percentage the top 5 editing of 2022 and their share of edits in each country
The Baseline
Figure 1 shows the number of edits made to OSM on a yearly basis. Since 2018 the number of yearly edits has increased from around 220 Million in 2018 to around 300 Million in 2021. In 2022 the number of total edits slightly decreased (counted at around 260 Million). For 2023 the data includes every edit made to OSM until 14th May 2023 (to be precise, the last changeset is dated at 2023-05-15 00:17:09) and was by then at around 97 million. In the 5 year period from 2018 and 2022 over 1 billion edits were made to OSM.
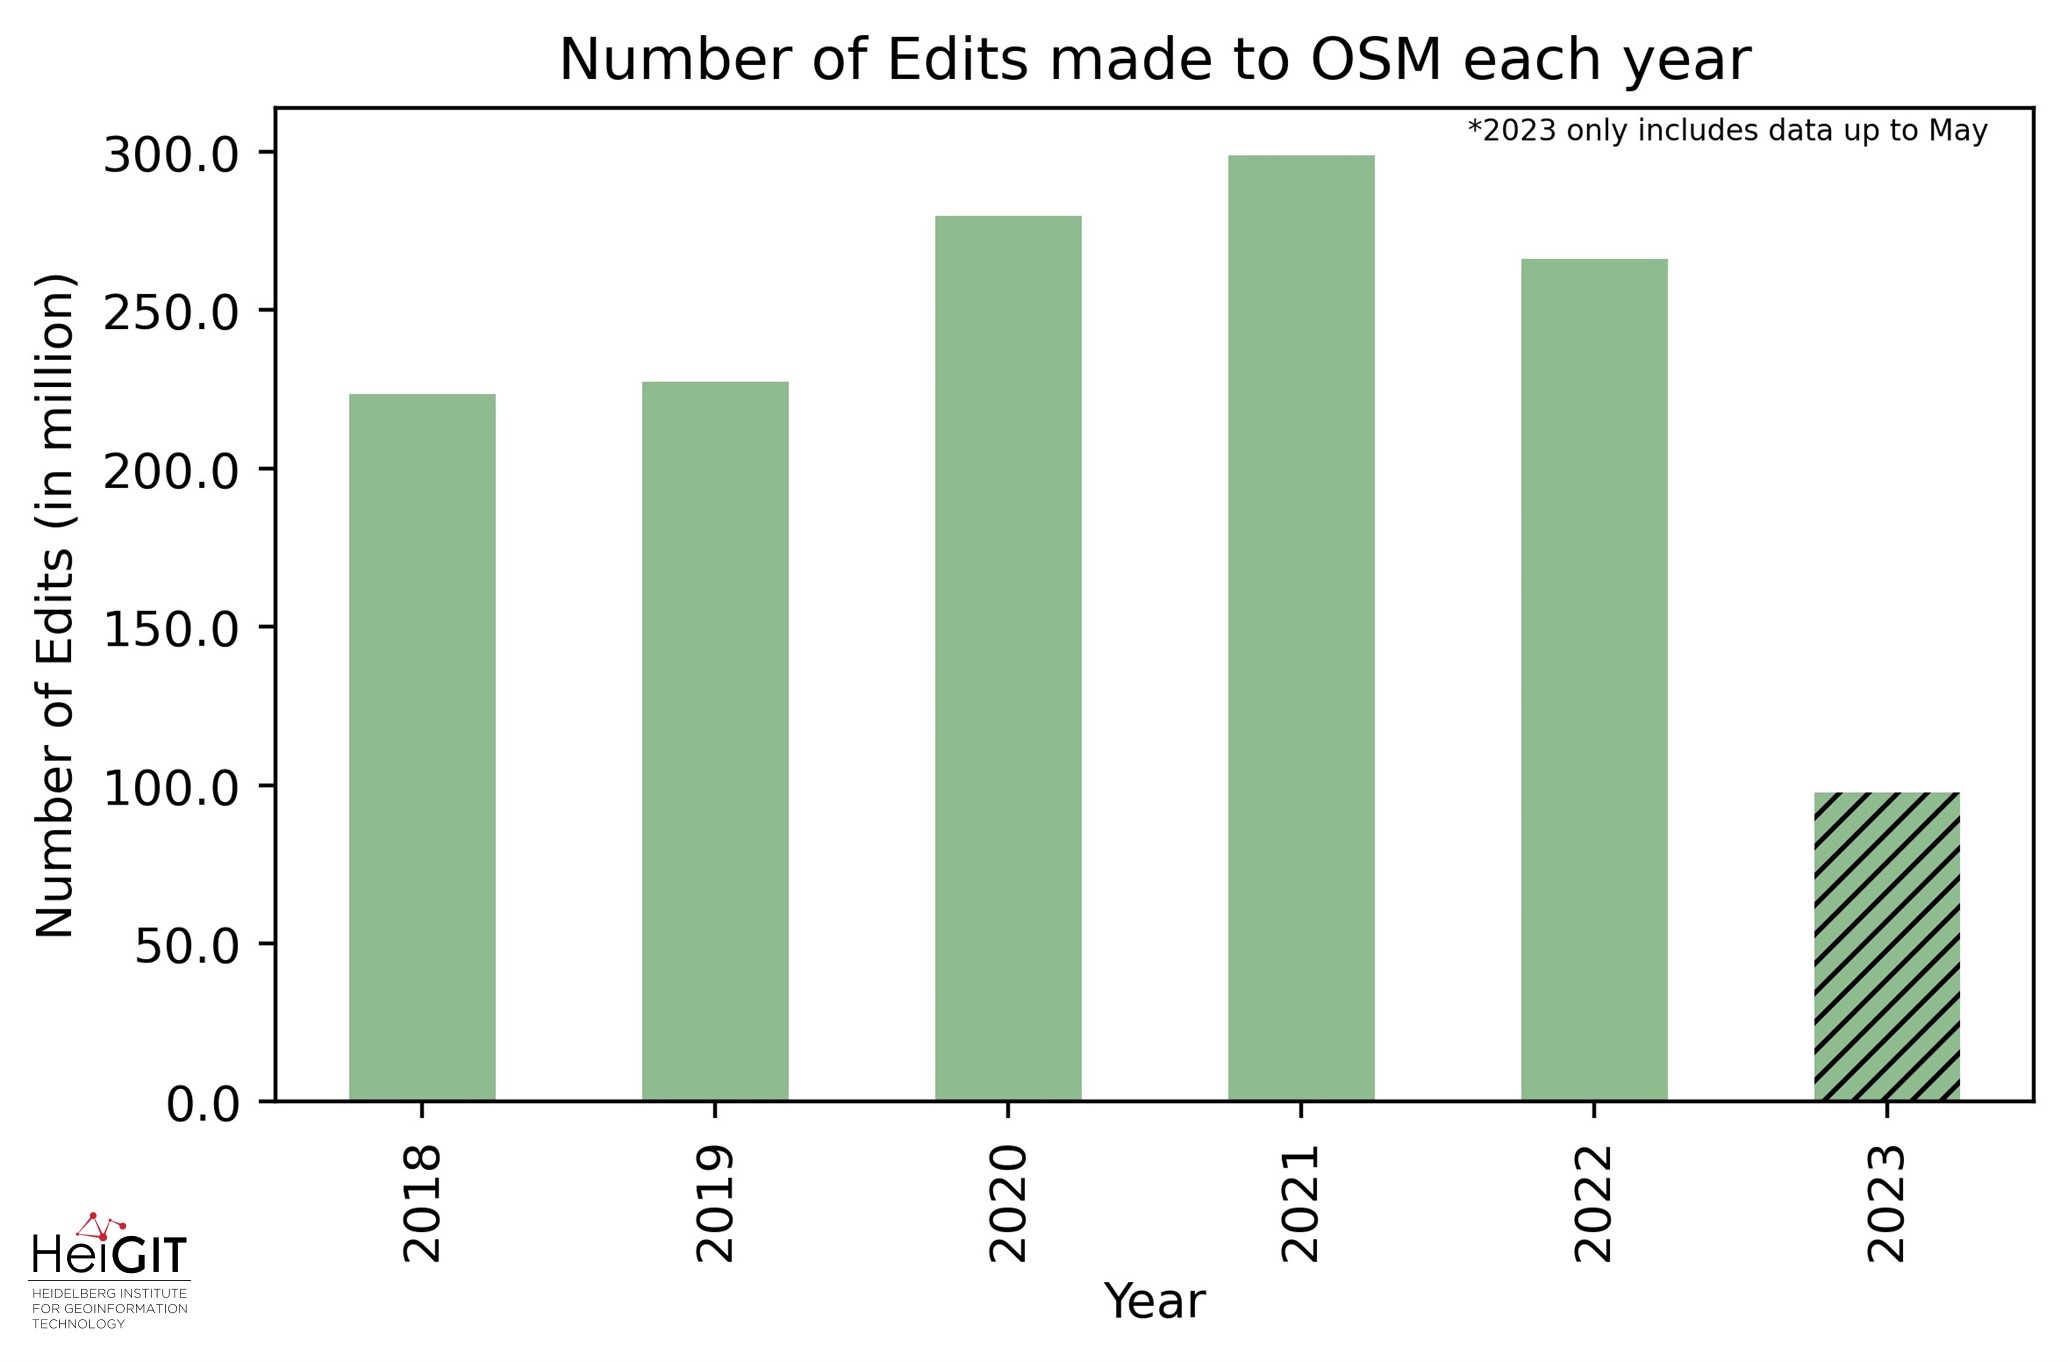
Figure 1: The total number of edits made to OSM in every year from 2018 to 2023 (May)
Both in 2018 and 2020, the number of active contributors reached more than 300.000, as seen in Figure 2. In 2022 the number slightly decreased and was counted at around 250,000. This means, that for 2022 for example, every active OSM contributor would have had to make around 1000 edits each on average. However, as for many other open communities work load in OSM is distributed much more unbalanced and the vast majority of contributors accounts for way less edits per year.
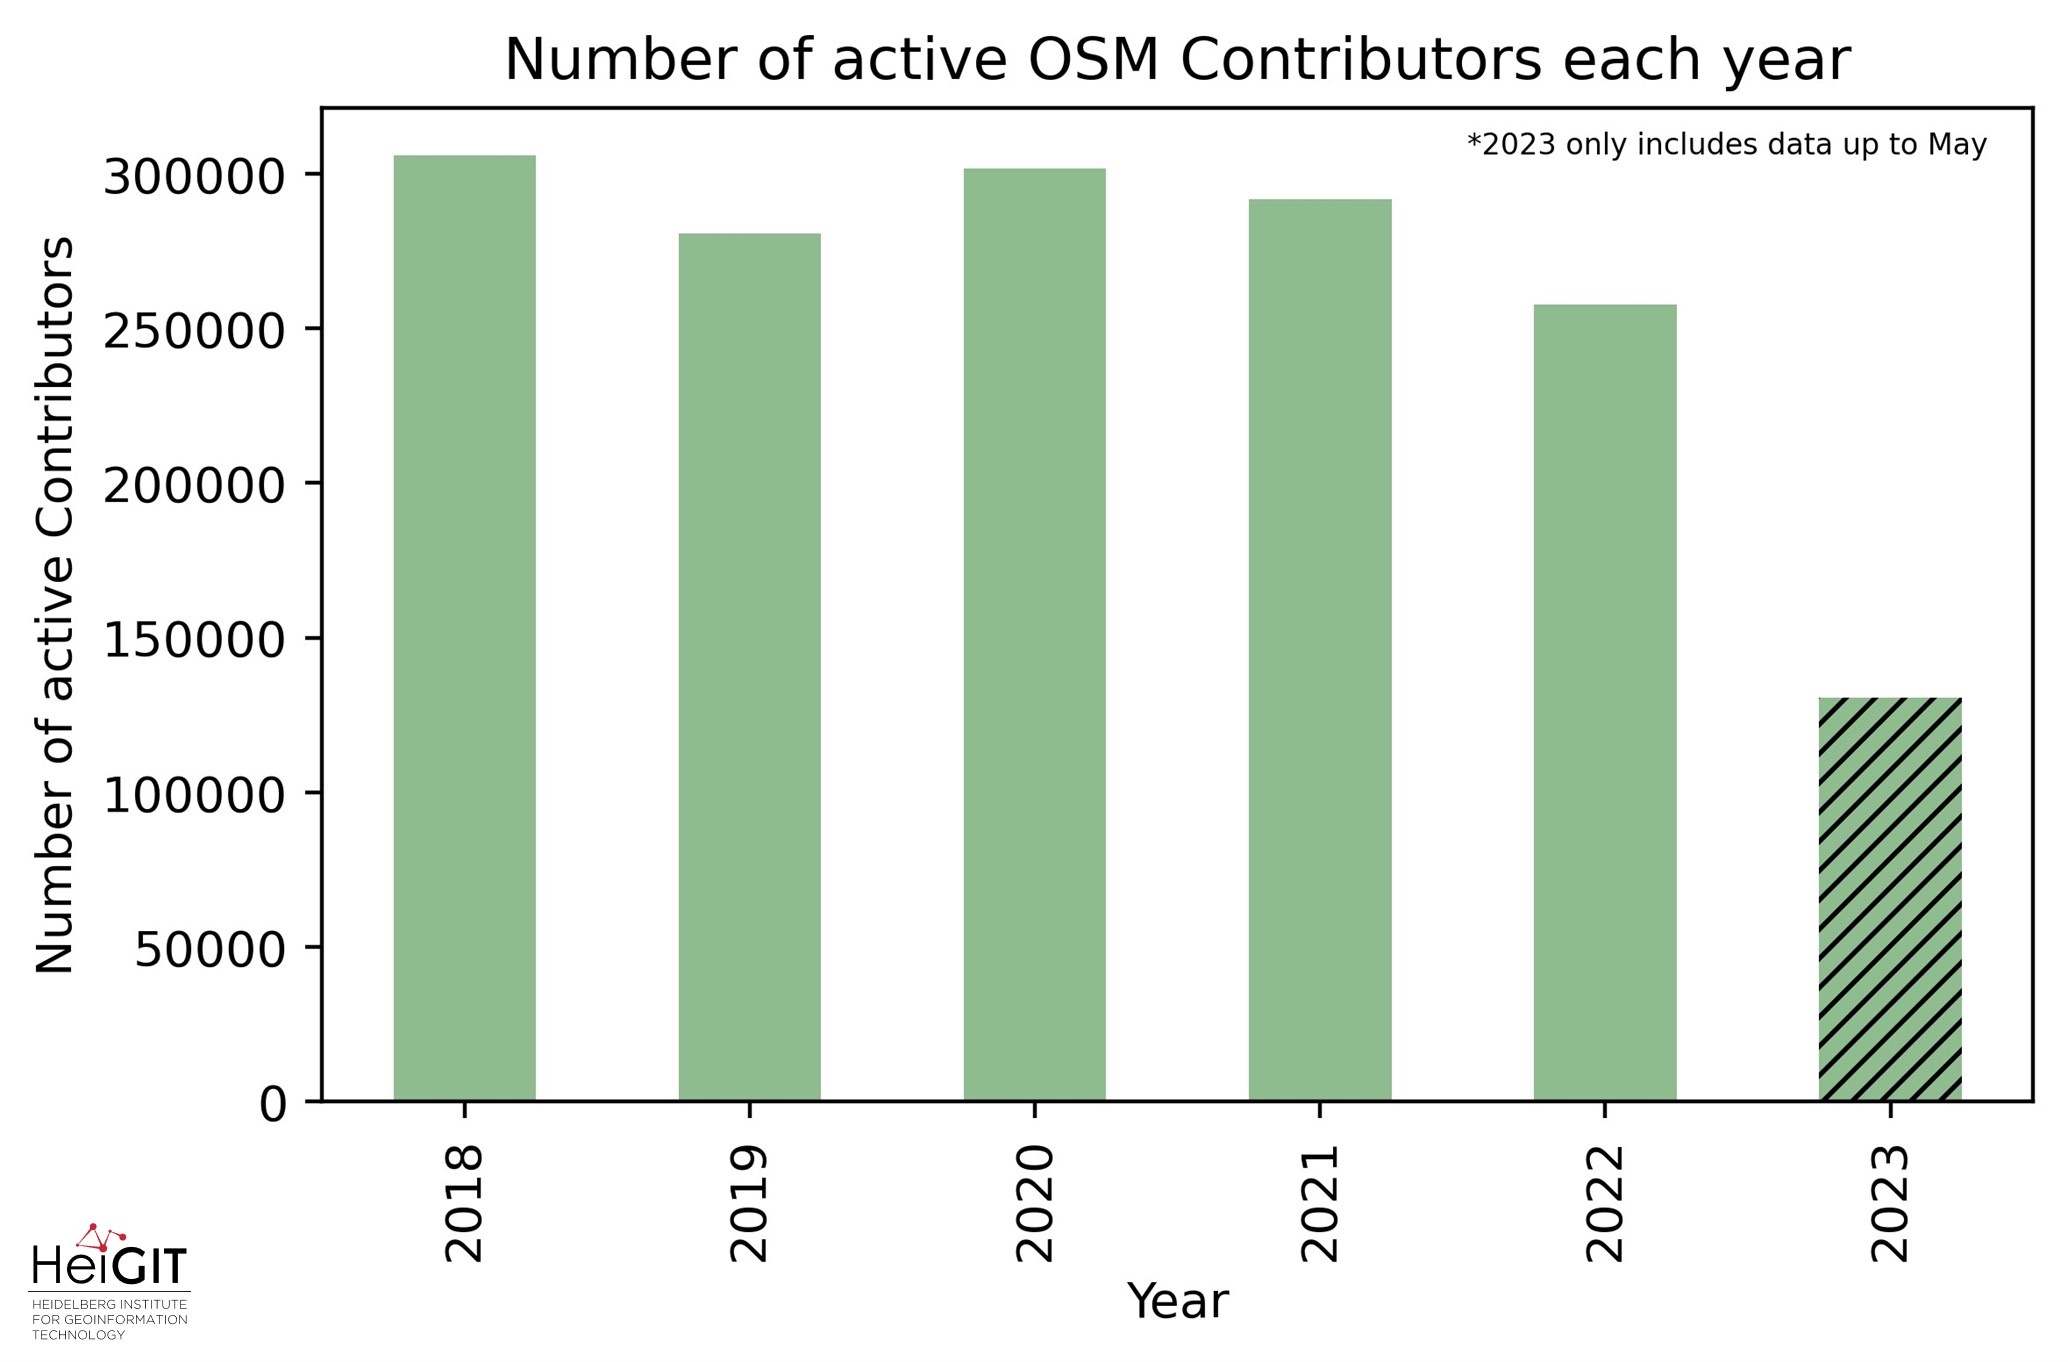
Figure 2: Number of active OSM contributors each year, starting from 2018. The numbers where derived by counting the distinct user IDs of OSM contributors for every year.
Temporal evolution of editor statistics for 2018 – 2023
The next figures show the editing software most used by contributors from 2018 to 2023. Again, this section is divided into the total number of edits, using the editing software and the total number of contributors using the editing software. The popularity ranking of the editing software varies between these two methodological approaches.
The most popular OSM editing software with the most overall edits since 2018
Let’s first take a look at the edits. Figure 3 clearly shows, that even among the top 5 editing software there are significant differences in the number of edits. JOSM being by far used for the most edits with around 150 million edits made accounting for far more than 50% of all edits made in 2018 and 2019.
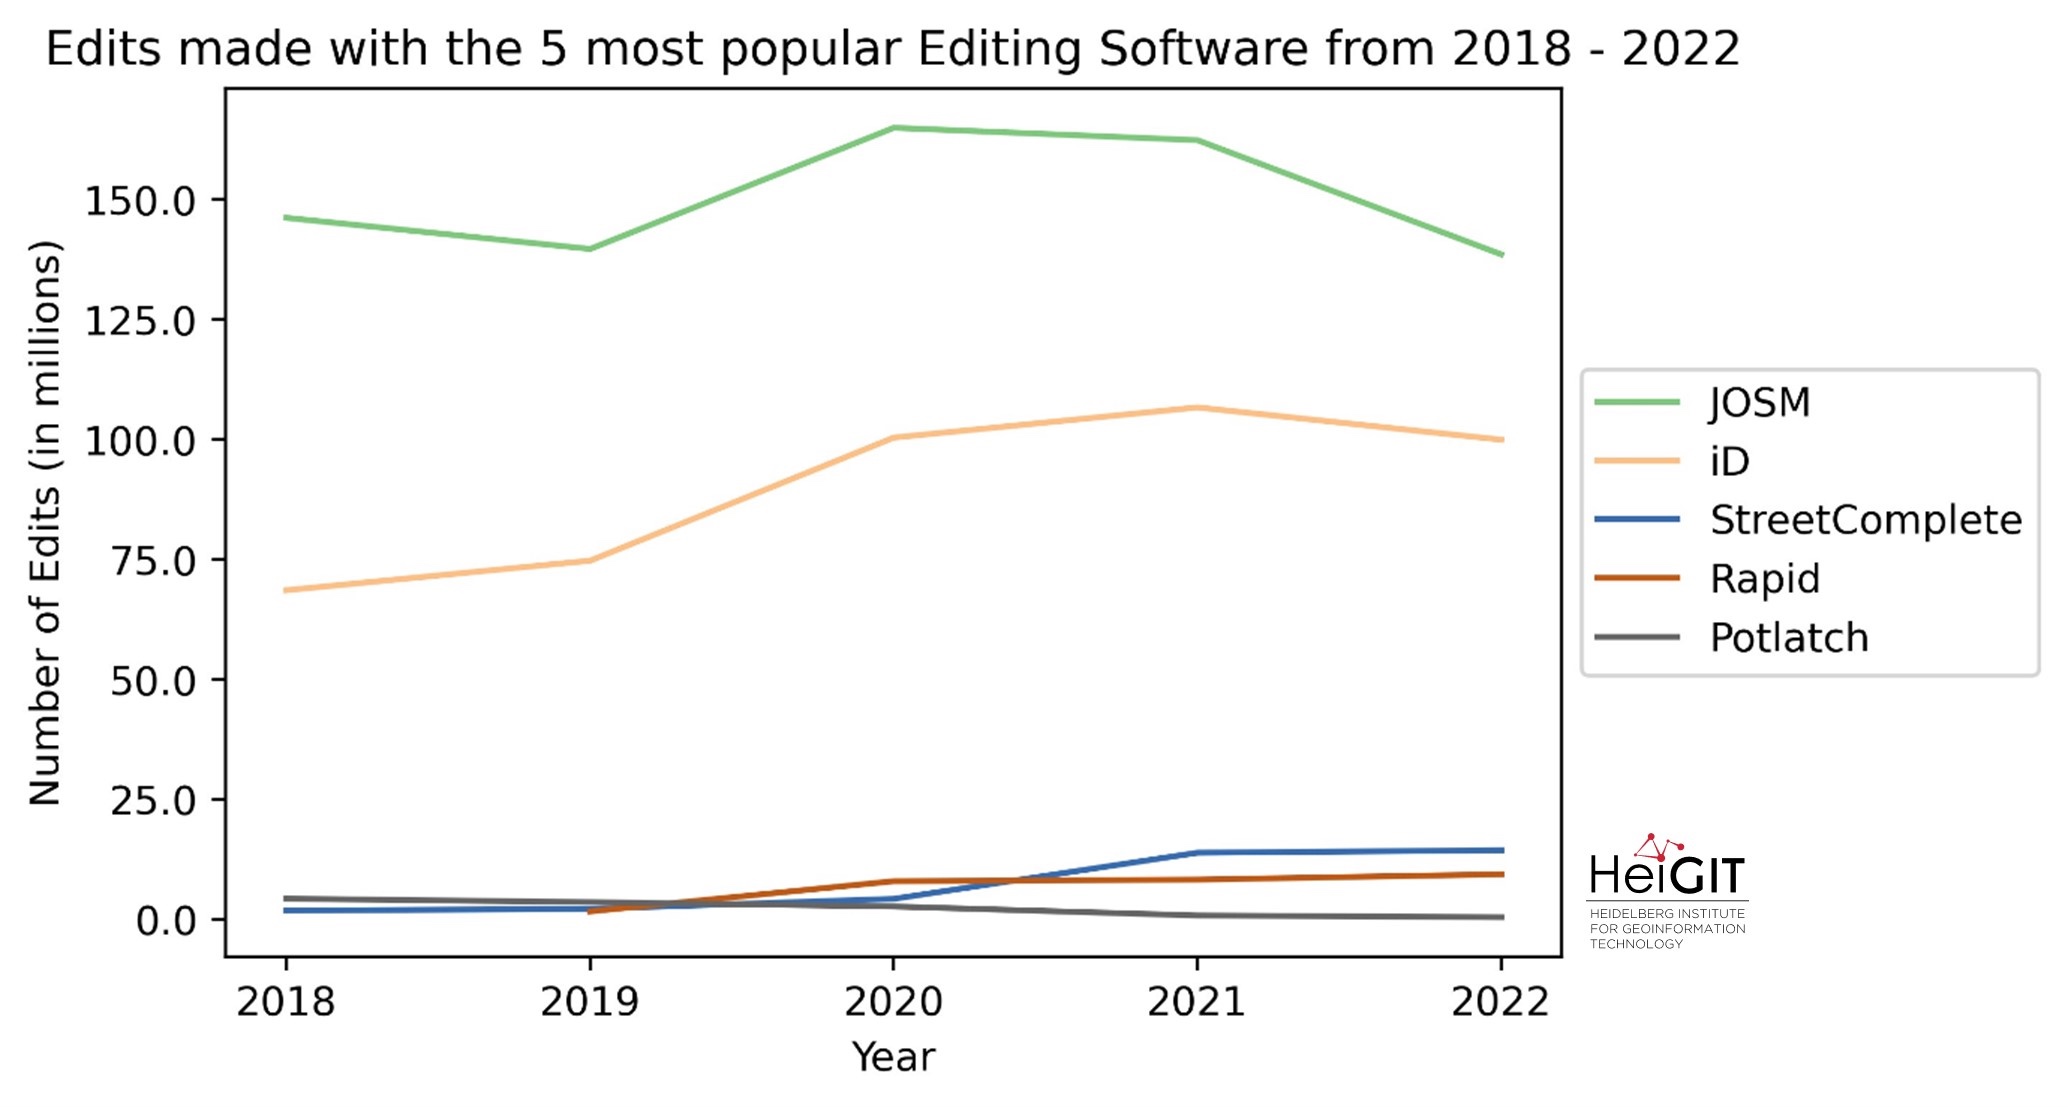
Figure 3: The total number of edits made with the top 5 editing software JOSM, iD, StreetComplete, Rapid and Potlatch from 2018 to 2022
Figure 4 shows the different editors each with their own y-scale, for a better view of the change in usage over the years. Together with the plot in Figure 3, the steady increase in popularity of iD since 2019 can be seen reaching around 100 million edits in 2021. The slight fluctuations in JOSM’s popularity are also more clear, for example from around 160 million in 2021 to around 130 million in 2022. Street Complete’s and RapiD’s increase in popularity since 2019 can also be observed. Albeit on a lower scale than JOSM or iD, both editors have marked a steady increase in usage. The usage of Potlatch on the other hand has decreased remarkably since 2018, with only around 40,000 edits in 2022, despite being a popular editing software in the early years of OSM.
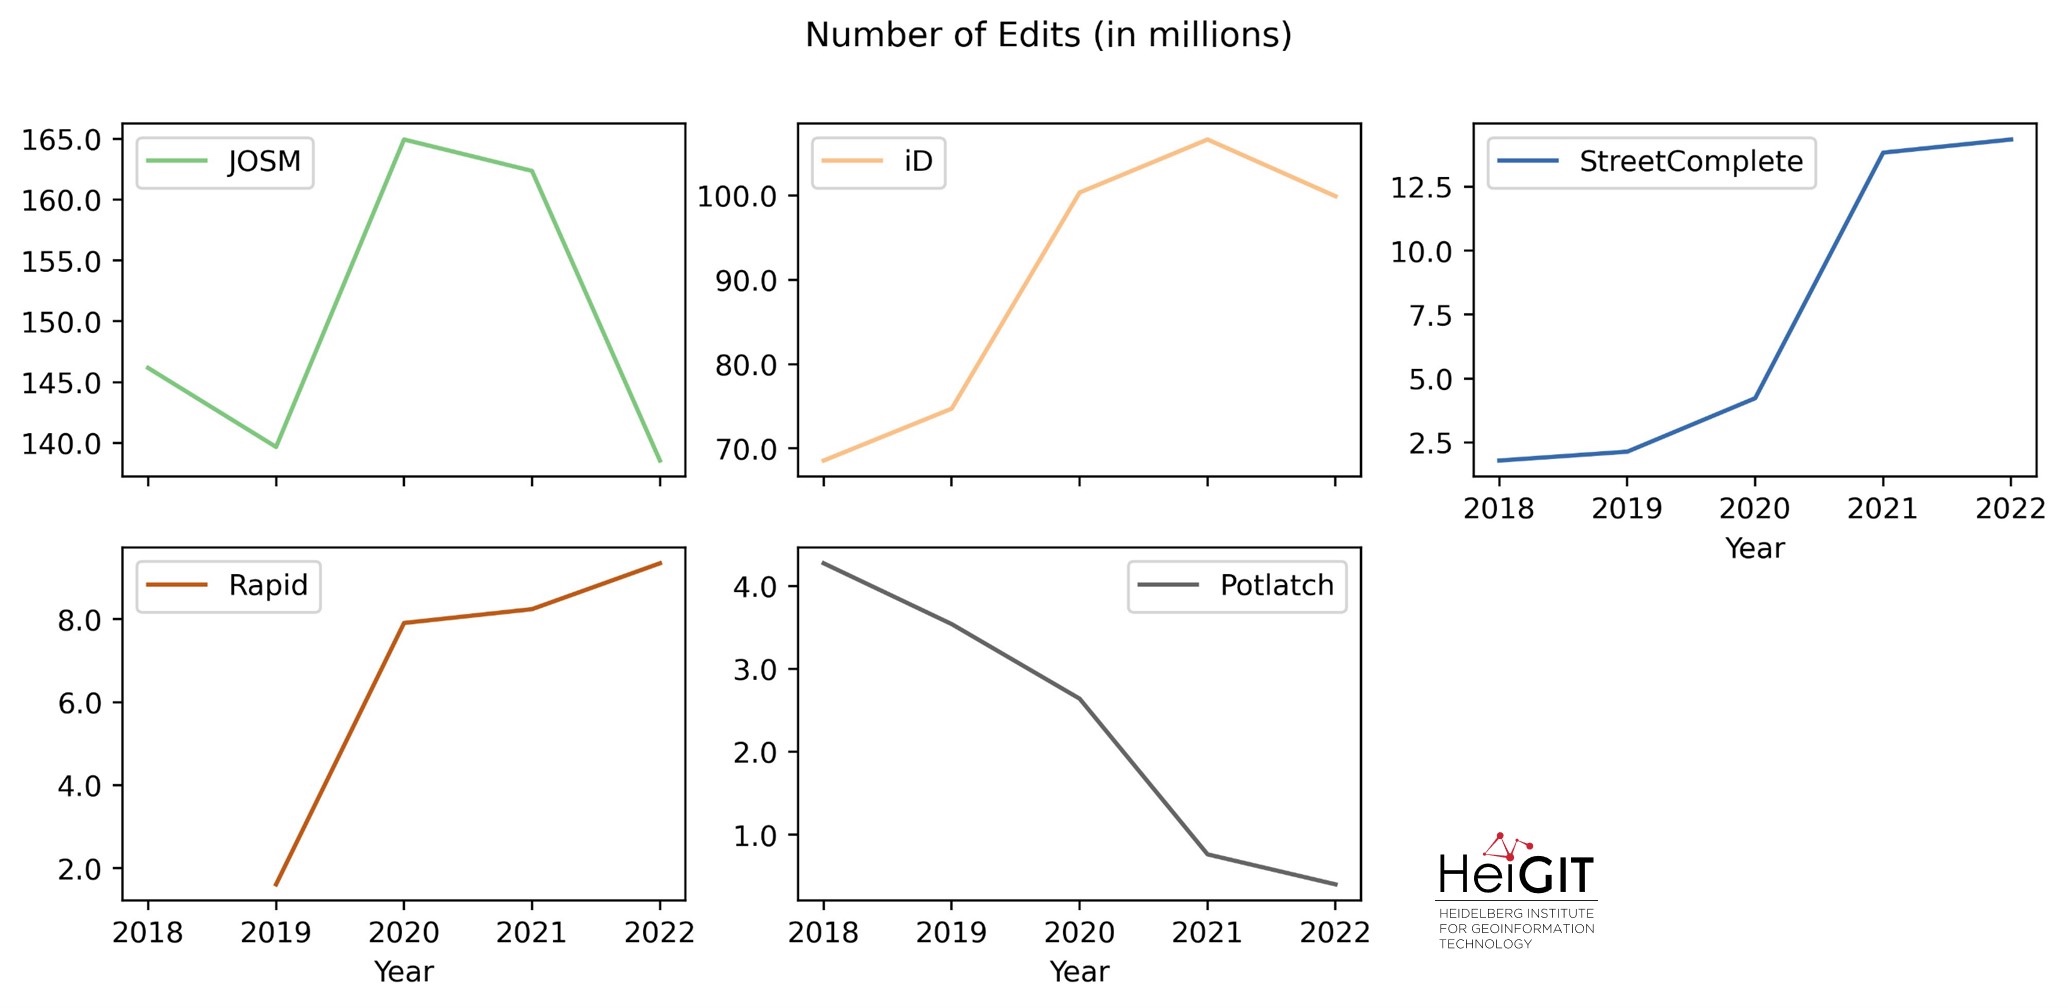
Figure 4: The number of Edits for the top 5 editing software, represented seperately, with a different y-scale for each plot
The most popular OSM editing software with the most overall active OSM contributors since 2018
The distribution of active contributors per editing software is a slightly different one compared to the numbers in the previous part. iD, JOSM and StreetComplete are still in the top 5, but iD has by far the most contributors at around 200,000 to 250,000 each year. After iD, MapsMe had the highest number of active contributors until 2021 (for simplicity MapsMe android and MapsMe iOS have been counted as one). Nevertheless, the ranking changed when StreetComplete overtook MapsMe, closely followed by JOSM in the next highest spots. From 9,700 active contributors in 2018 to 23,000 in 2022 StreetComplete especially had a large increase in their active user base. JOSM has continuously kept a user base of around 20,000. But a very active one at that, if compared to the number of edits made through JOSM.
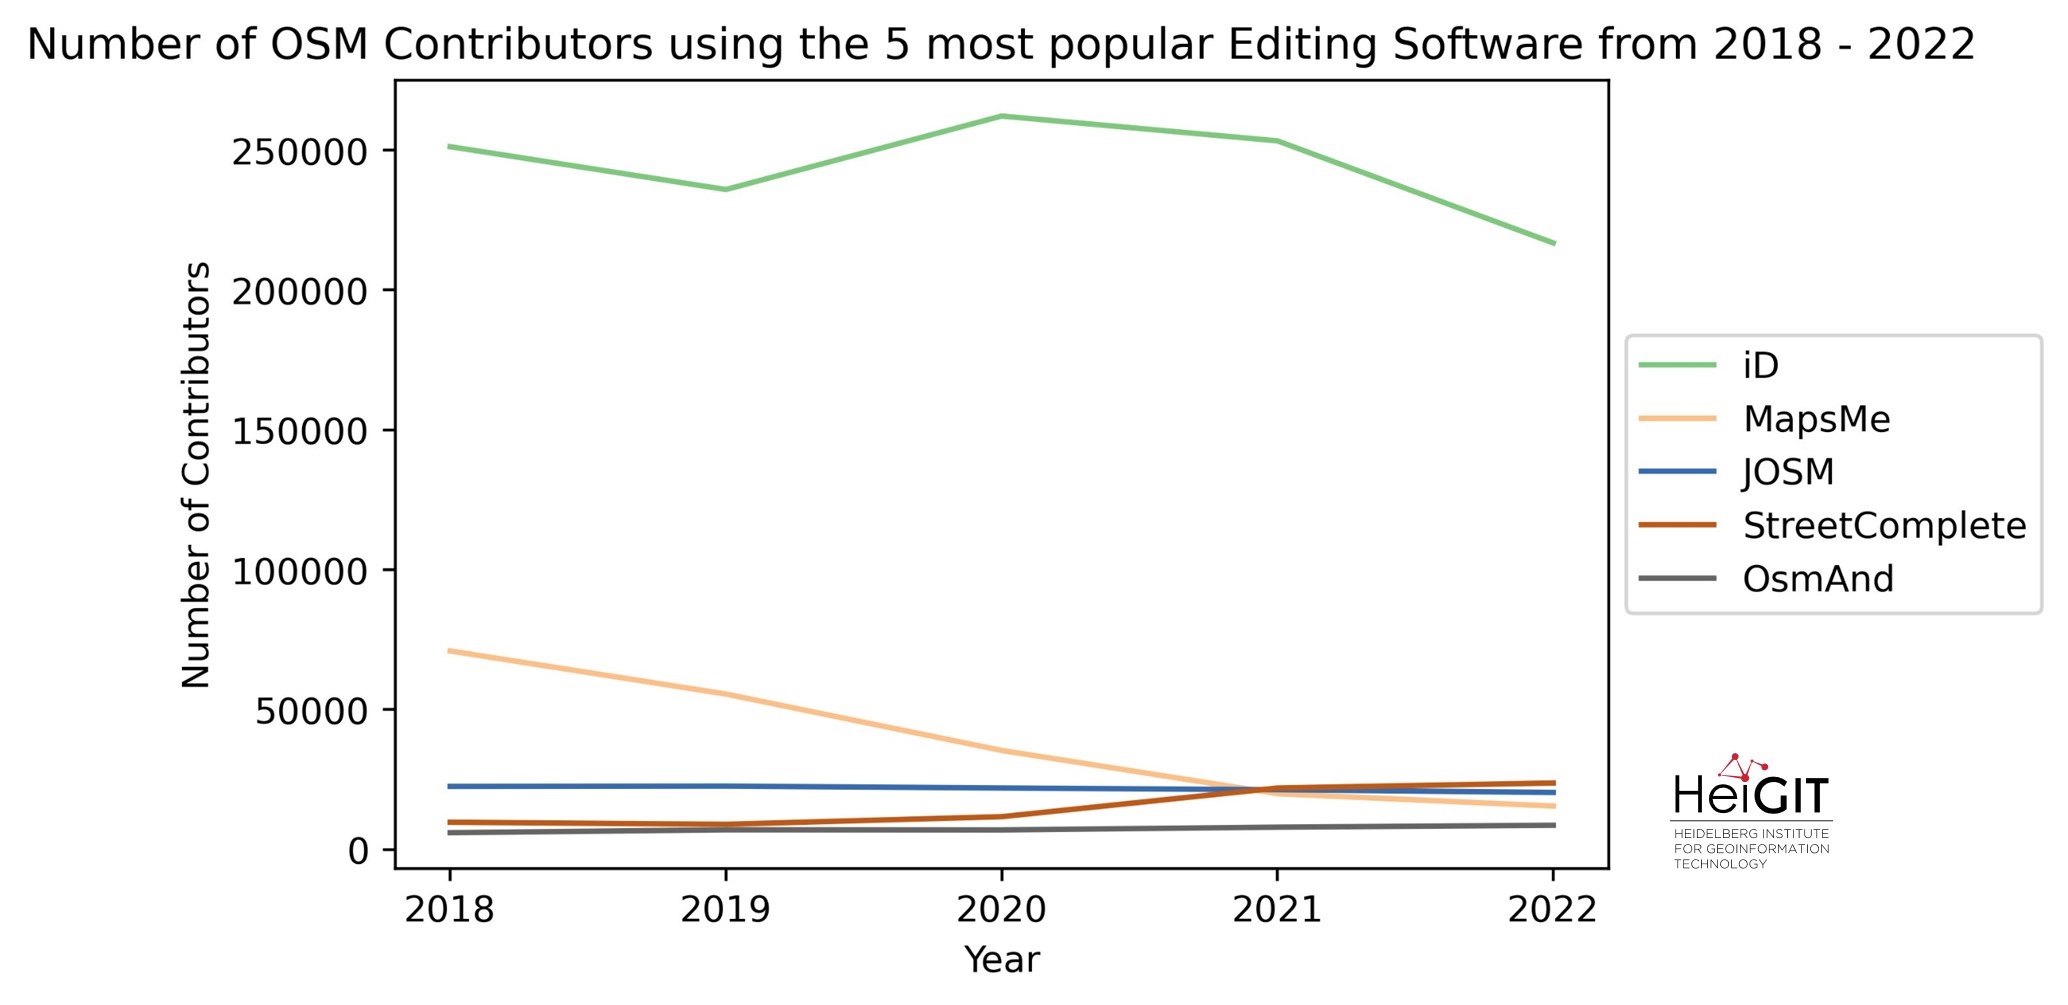
Figure 5: The total number of active contributors from the top 5 editing software iD, MapsMe, JOSM, StreetComplete, and OsmAnd from 2018 to 2022
Potlatch and Rapid are no longer in the list, but still are relatively high up on place 7 and 8, respectively. Although it is remarkable that in 2022 Potlatch only counted a total of 337 active contributors (responsible for more than 400,000 edits). As seen in the separate graphs in Figure 6, OsmAnd has also garnered a steady increase of active contributors, with an increase of around 2,000 yearly active users within the past 5 years.
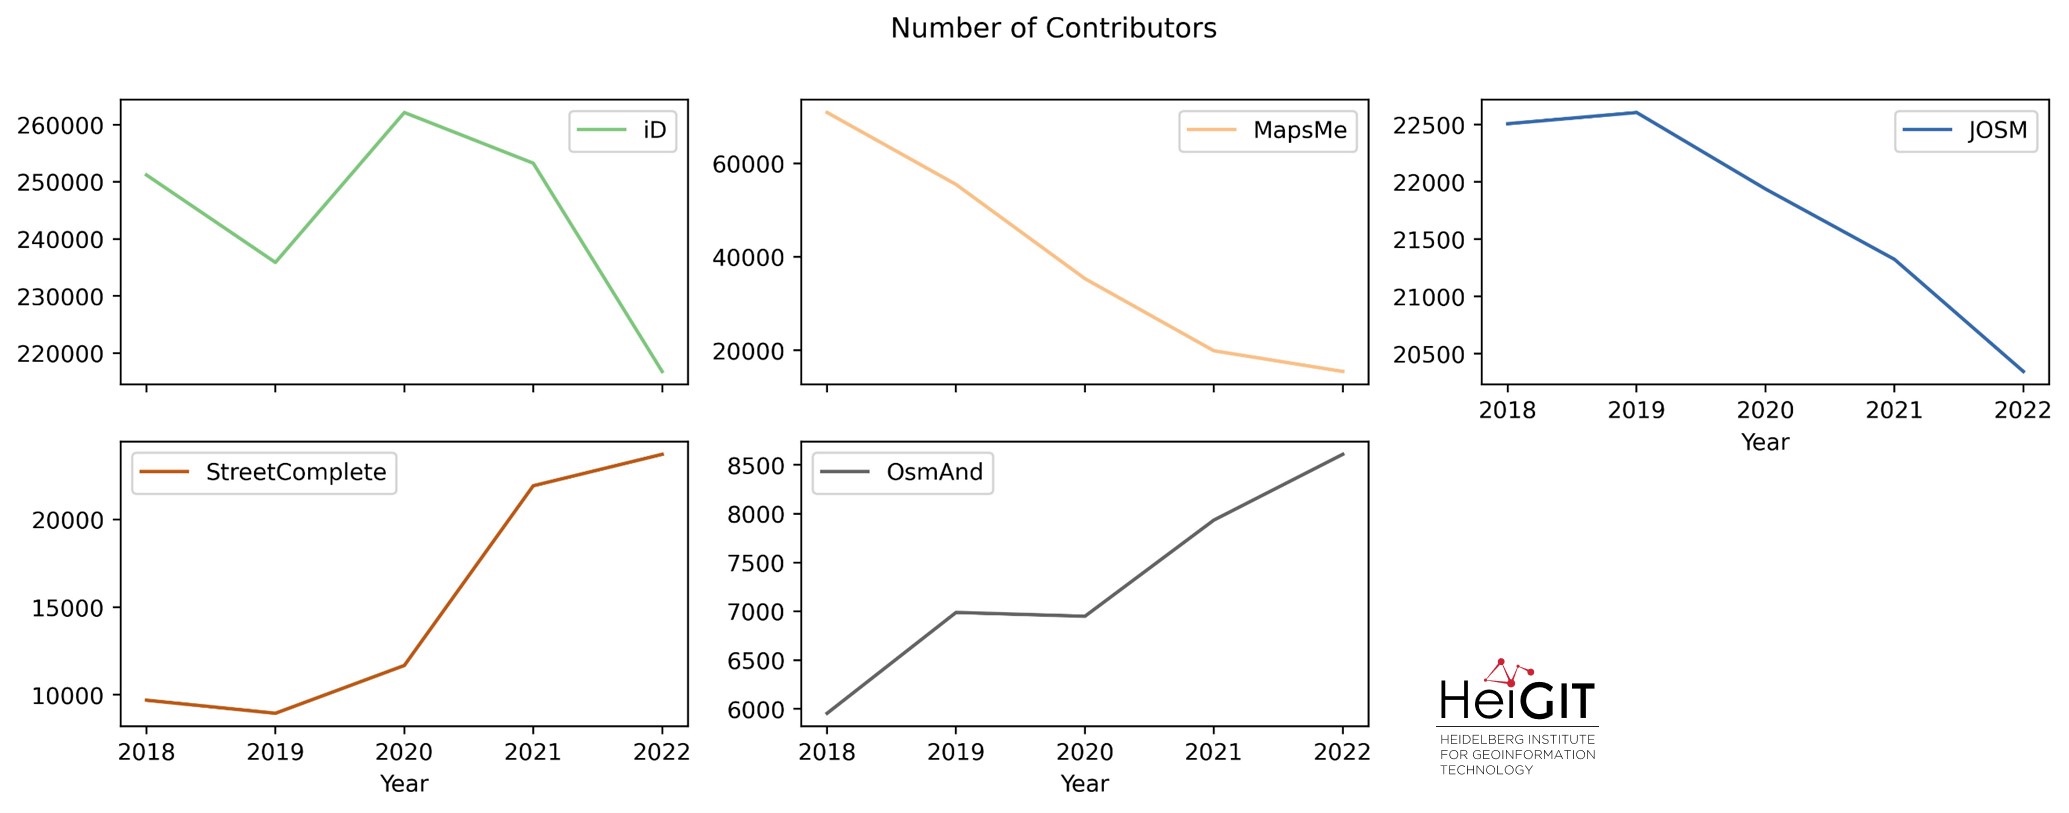
Figure 6: The number of active contributors for the top 5 editing software, represented seperately, with a different y-scale for each plot
It is noteworthy that some contributors might be active on several platforms, so these figures don’t represent distinct users in general, only distinct users per editing software. Therefore, the sum of the individual editor statistics might be even higher than in Figure 2, counting all distinct active contributors per year. It is also worth noting that there are more than a hundred different editing software in different versions that can be used to upload data. In 2023 alone, more than 2,254 software versions were used, with more than 140 distinct editing software. The top 5 account for the majority of all edits and all active contributors though.
Detailed view on editor statistics for 2022
Now that we’ve seen a more detailed view on the editing software used by members of the OSM community over a 5 year period, this next section will focus on the year 2022 and give a more detailed look on the countries in which these editors are especially popular.
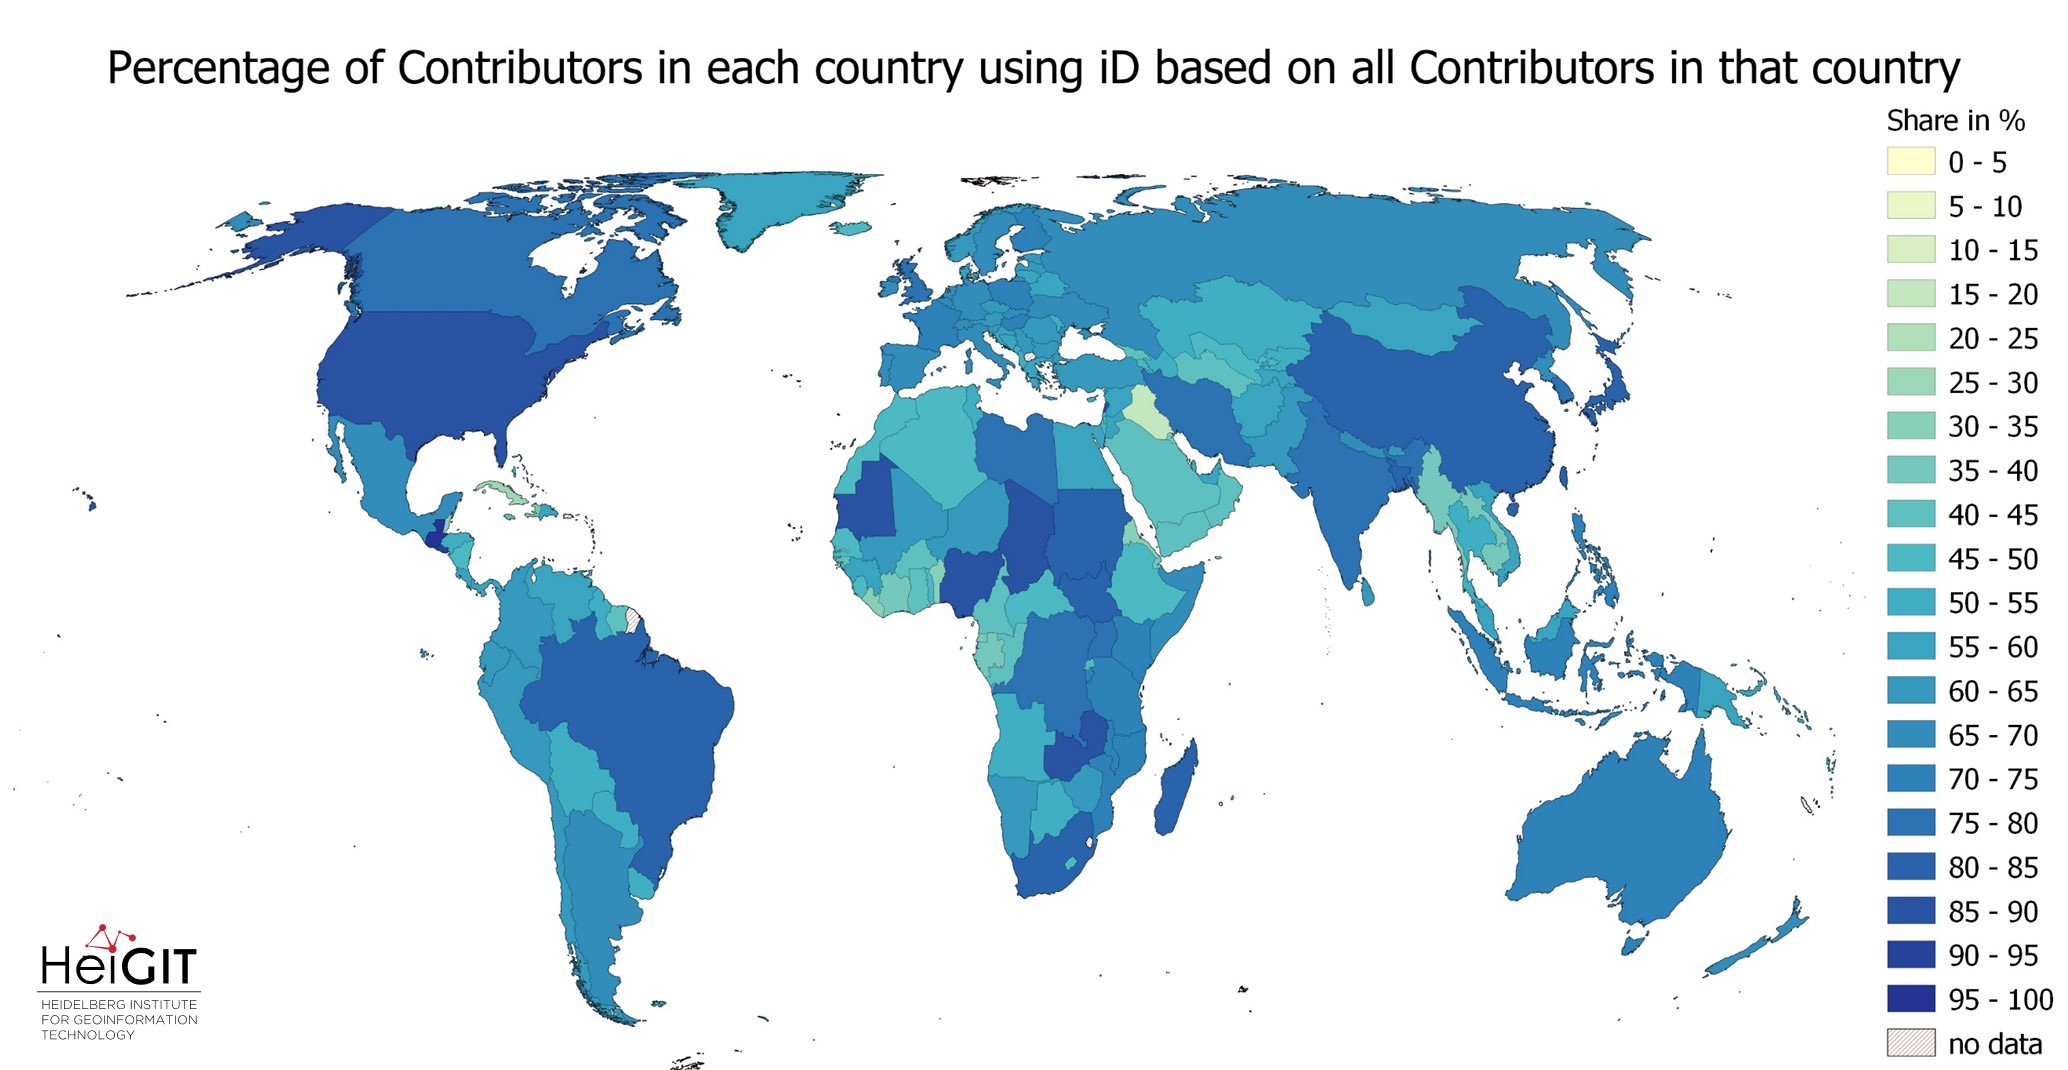
In 2022 of the total number of active contributors, 79% were using iD, 9% StreetComplete, 7% JOSM and around 6% MapsMe and around 3,5% OsmAnd. Again, since the number of distinct contributors were counted for each software, an overlap between different software can be expected, since one user could be actively using more than one software. This should be kept in mind when looking at all following maps.
The following 5 maps show the percentage of active contributors in each country using one of the 5 most popular editors calculated based on the total number of active contributors in that country. Both JOSM and iD are being used in every country, while StreetComplete and MapsMe and OsmAnd don’t have any users in around 30 countries.

Figure 7: Popularity of iD around the globe. Out of the 16,292 active OSM contributors in Guatemala around 97% (15,794) were using iD. In general the popularity of iD can be seen worldwide, with a few exceptions.
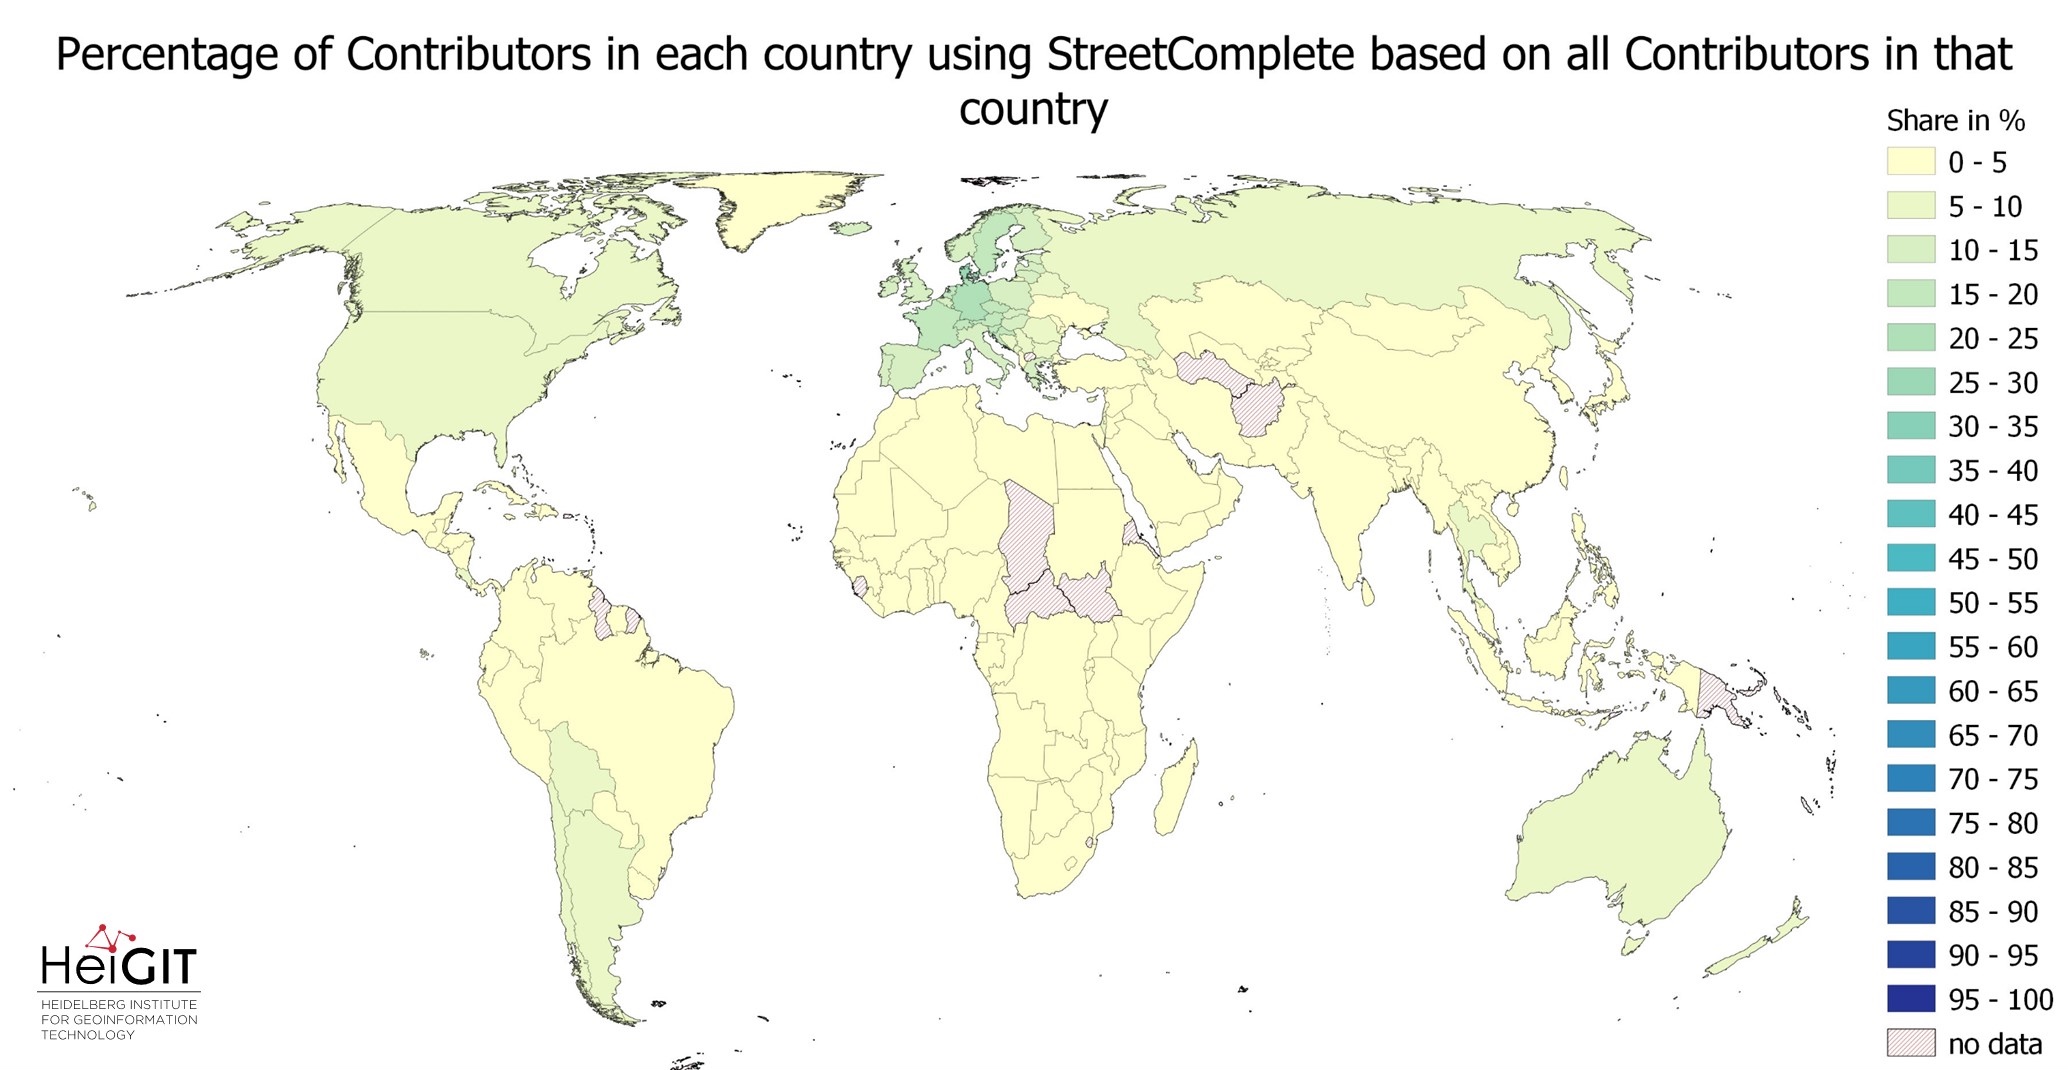
Figure 8: Popularity of StreetComplete around the globe. StreetComplete is especially popular in central Europe and Scandinavia with the highest percentages in Denmark, Germany and France.
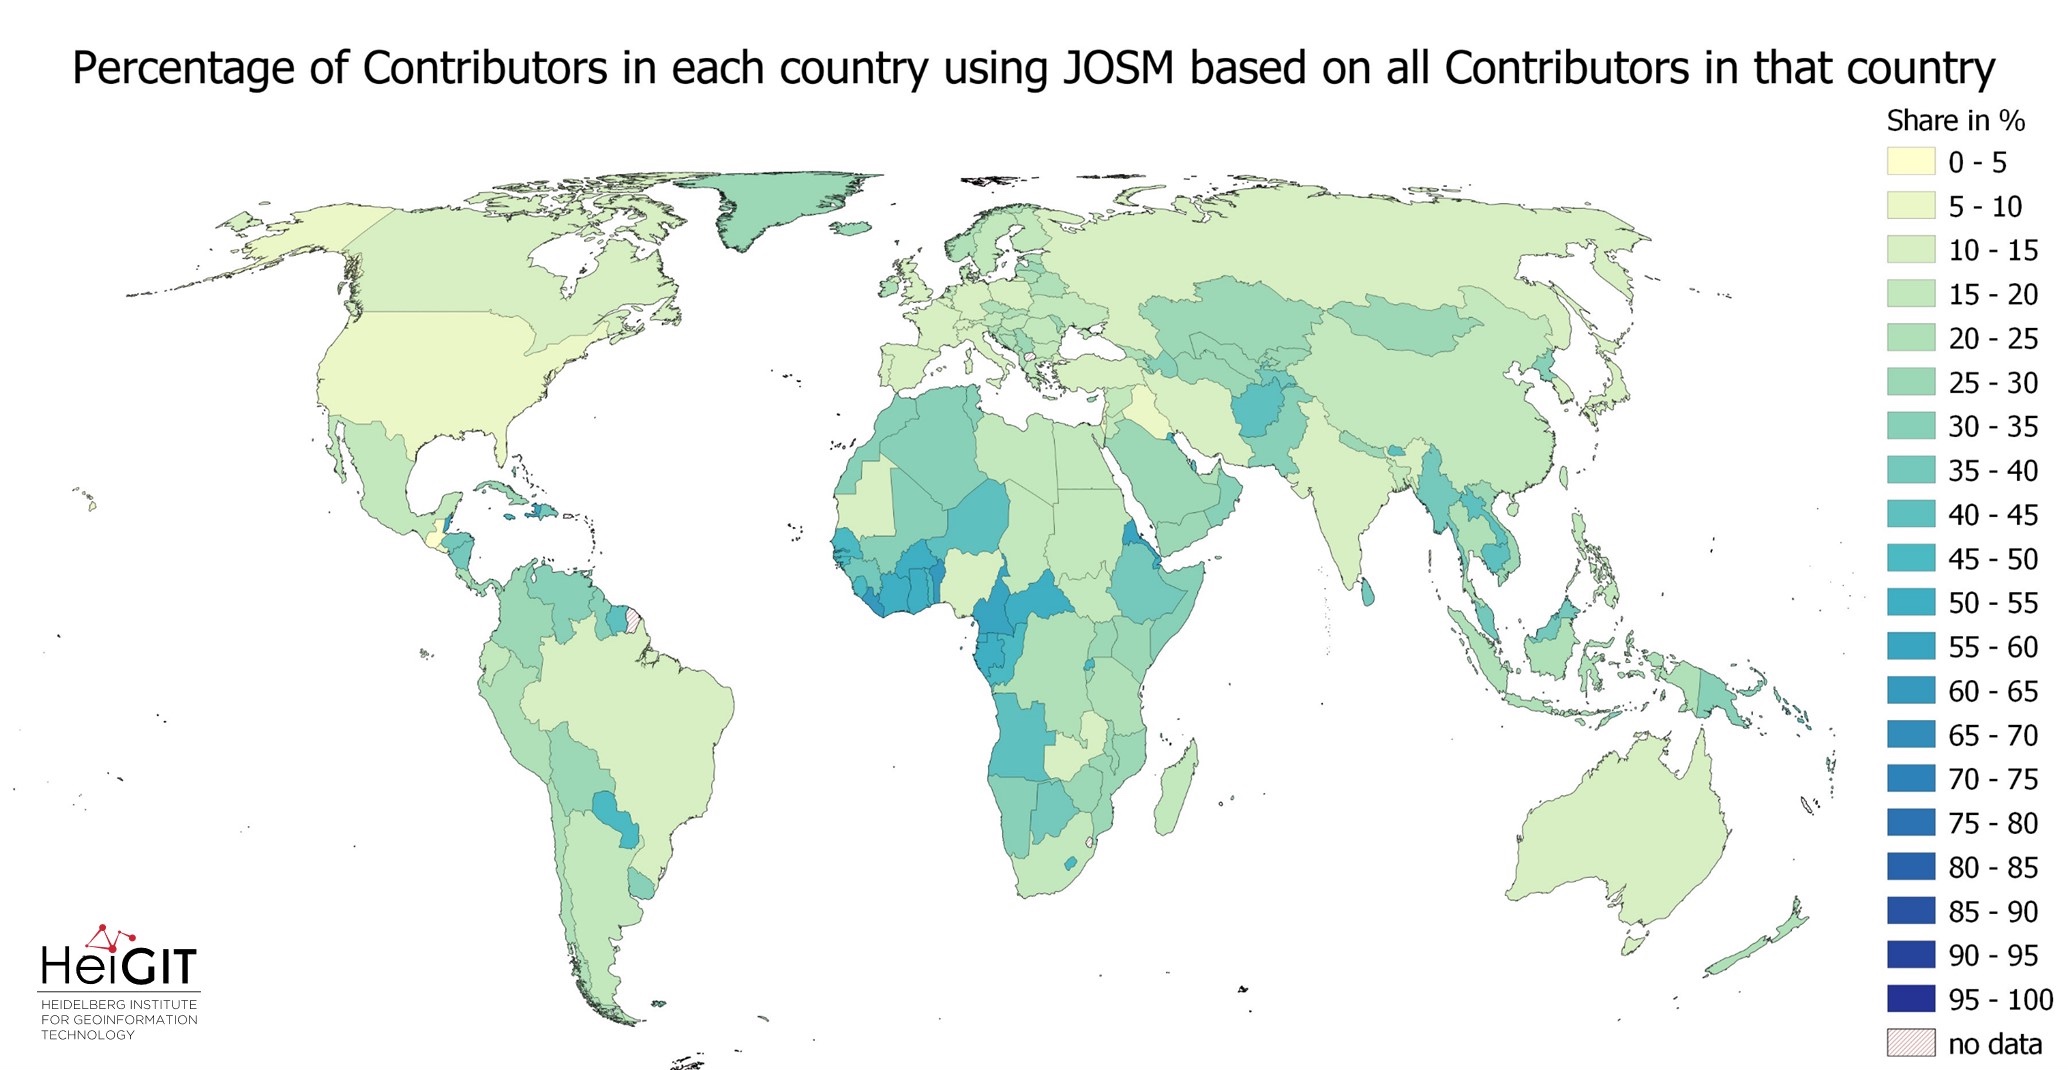
Figure 9: Popularity of JOSM around the globe. JOSM is still relatively popular in many countries, especially ones with a lower number of active contributors in total, with usage of 50% – 70%.
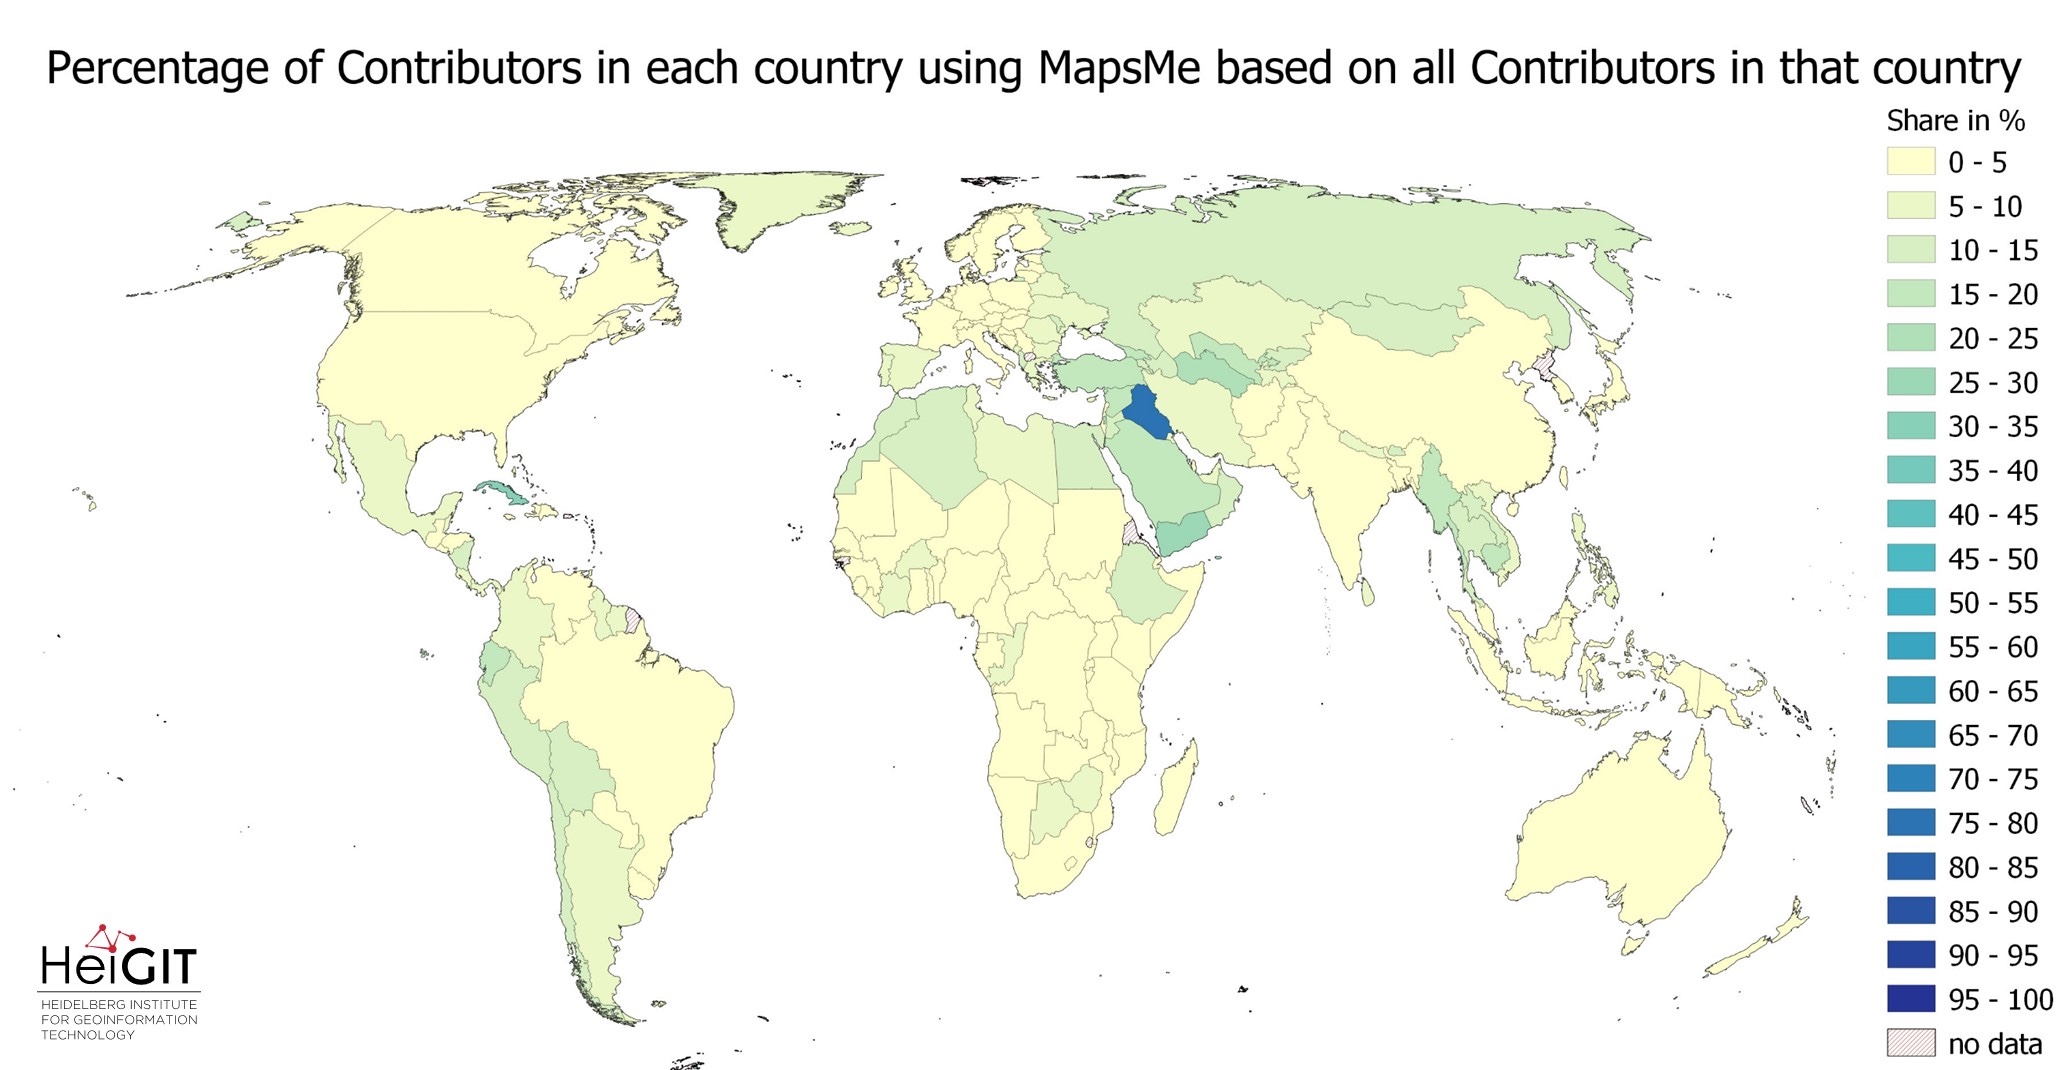
Figure 10: Popularity of MapsMe around the globe. Especially noticeable is that of the 3,785 active contributors in Iraq 75% are using MapsMe. In comparison only 18% are using iD. MapsMe is in no other country that popular. The 2ndand 3rd spot are taken by Cuba and Yemen with only around 300 and 115 contributors respectively, accounting for around 30% of all contributors.
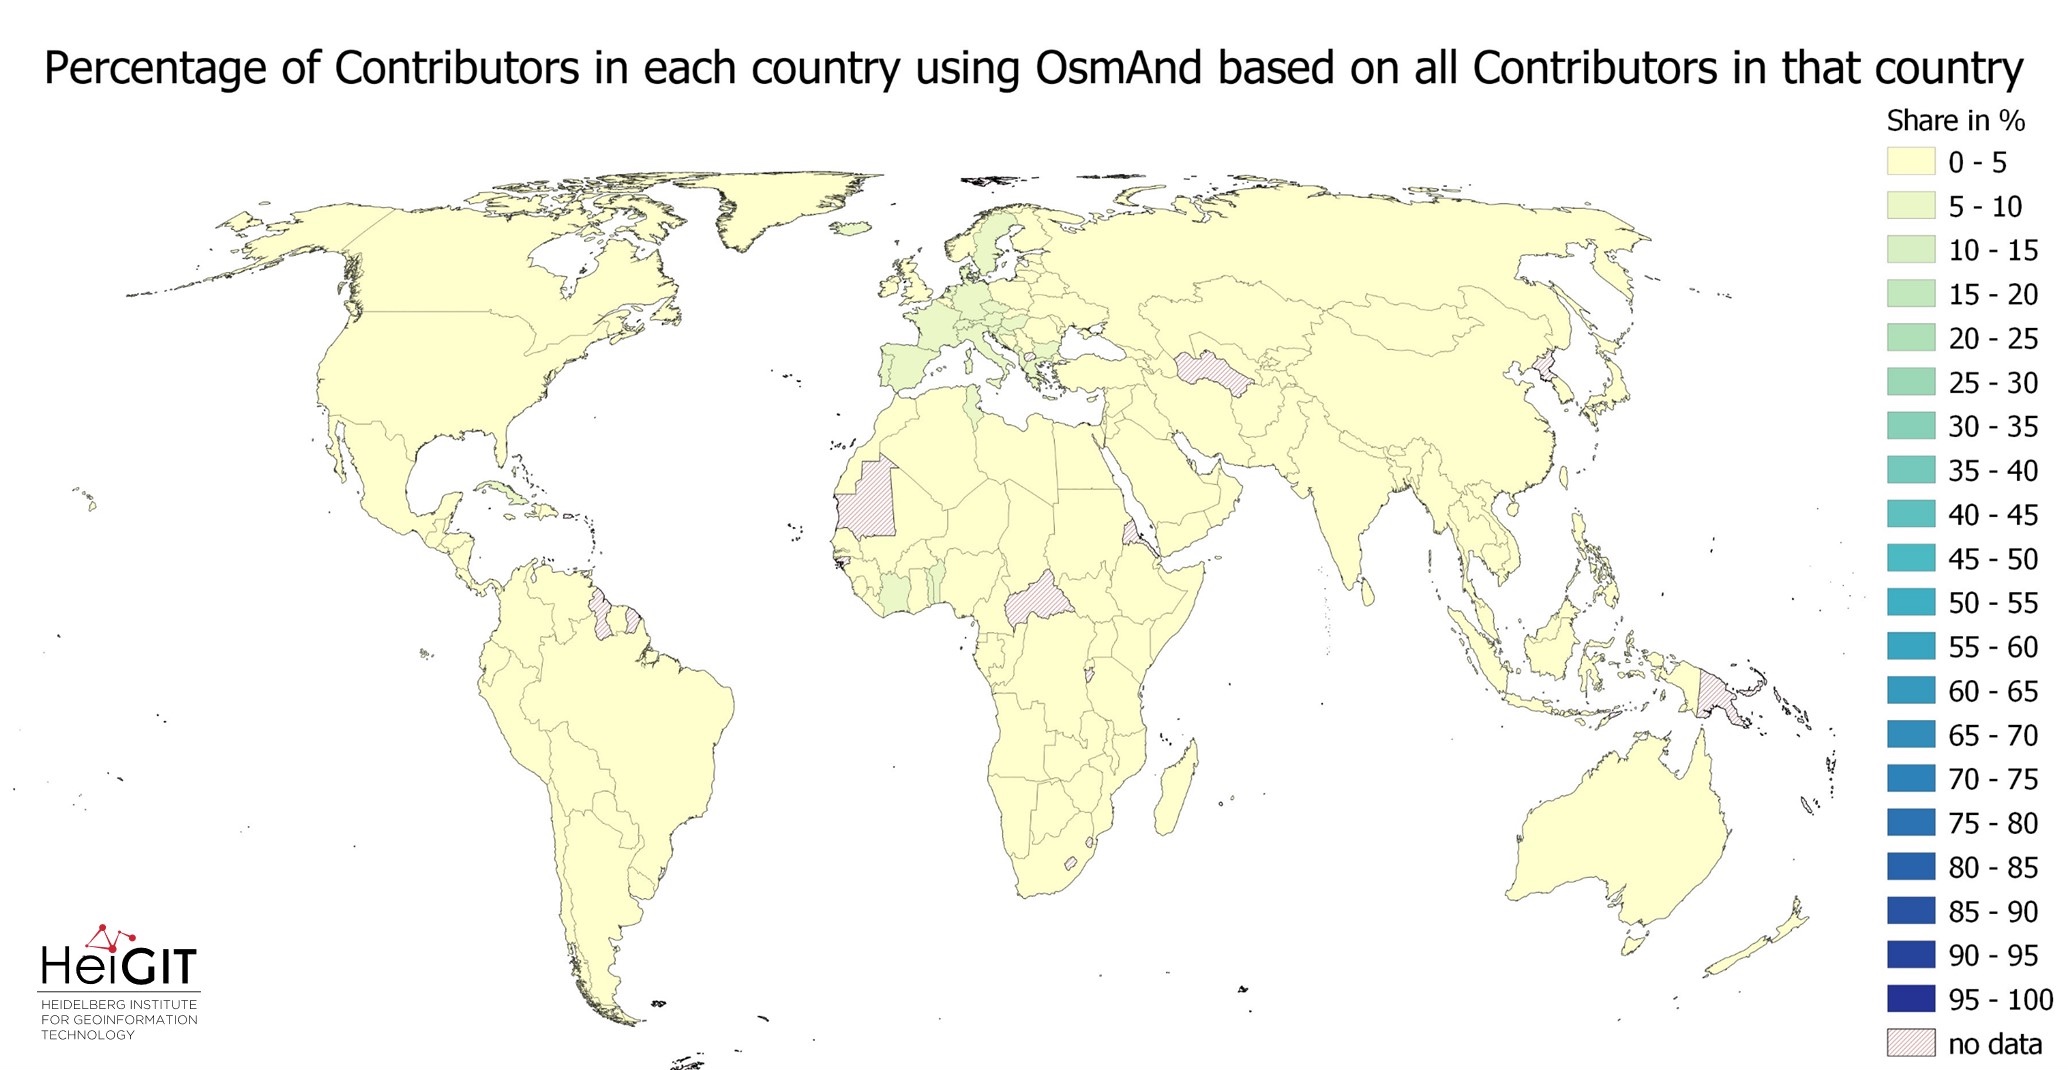
Figure 11: Popularity of OsmAnd around the globe. OsmAnd reaches its highest usage rates in Cuba with around 10%.
This has been all for today on OSM Editing Statistics. Stay tuned for future analyses to come with our “enriched” dataset.
If you remain interested in other work concerning OHSDB, please check out these other blogs, for example: https://heigit.org/oshdb-version-1-0-has-arrived/ or https://heigit.org/press-release-new-tool-allows-look-into-the-history-of-openstreetmap. Interested in the ohsome API? Check out the how to become ohsome series https://heigit.org/tag/become-ohsome/.