

At HeiGIT and in particular within the ohsome team, we strive to provide valuable insights into OpenStreetMap (OSM) data. The ohsome API offers aggregated statistics on the evolution of OSM elements since 2020. These are made easily accessible by the ohsome dashboard. With the ohsome quality API, previously called ohsome quality analyst (OQT), we continue in this vain by computing and make available quality estimations of OSM data. The ohsome quality API builds upon the ohsome API and is integrated into the ohsome dashboard.
The current, stable state of the ohsome dashboard and ohsome quality API was finally achieved after the last six months of cumulative effort and as the result of a 3-months long exploration project with the Federal Agency for Cartography and Geodesy. However, stable does not mean finished, and we will continue to improve both services and enhance their usefulness to the community.
So what exactly did we do until now?
How up-to-date is OSM data?
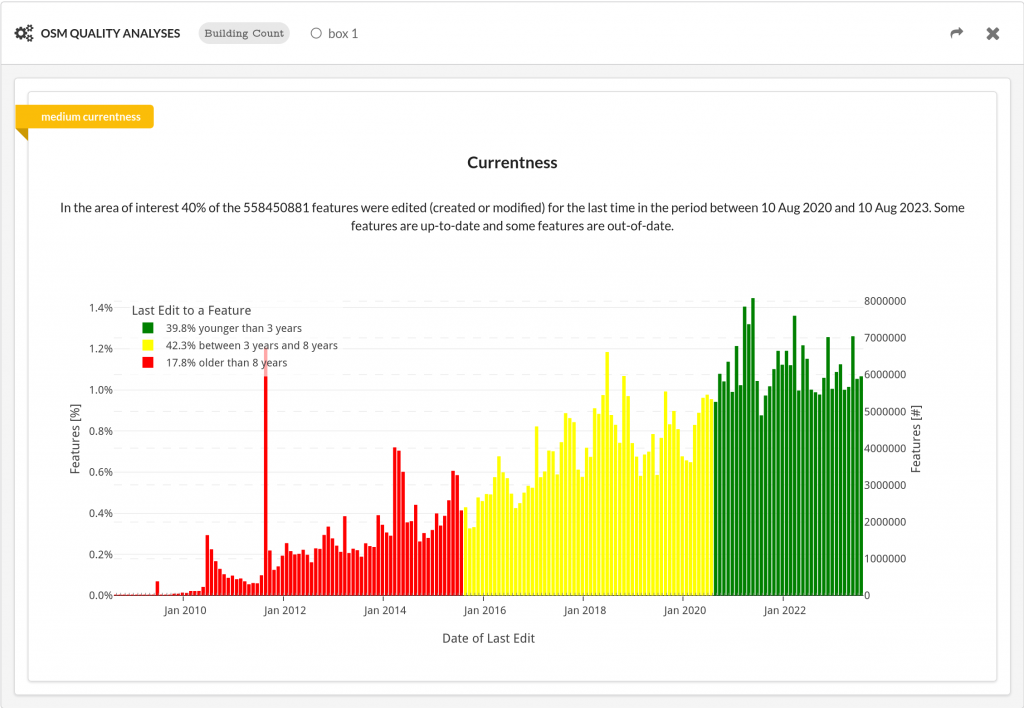
First, we completely overhauled the Currentness indicator. This indicator gives an estimation about the up-to-dateness of features in OSM. Goals of the rework have been to improve correctness, performance and readability.
In regard to correctness, the decision when a feature is up-to-date, out-of-date or in between is based on the topic (e.g. roads or supermarket). The geometry of a road can be up-to-date, even if the last edit has been 4 years ago. In contrast, opening hours added to a supermarket in OSM 4 years ago is probably out-of-date.
Enhancements in performance were achieved through the reduction of retrieval requests for OSM data from the ohsome API. This has enabled on-the-fly computation of the Currentness indicator for entire countries.
In order to ensure clarity in the interpretation of the Currentness indicator, significant consideration was given to both the result description and accompanying visual representation. Convince yourself. If you have feedback about this effort, please tell us!
Bringing quality indicators into the ohsome dashboard
The most significant usability improvement in the ohsome quality API has materialized through its seamless incorporation into the ohsome dashboard, as elaborated in our recent blog posts.
Building upon this progress, we have further expanded the dashboard’s capabilities by integrating the Currentness indicator. This advancement not only offers the choice between two distinct indicators but also facilitates the concurrent selection, computation, and presentation of both indicators. Try it out yourself.
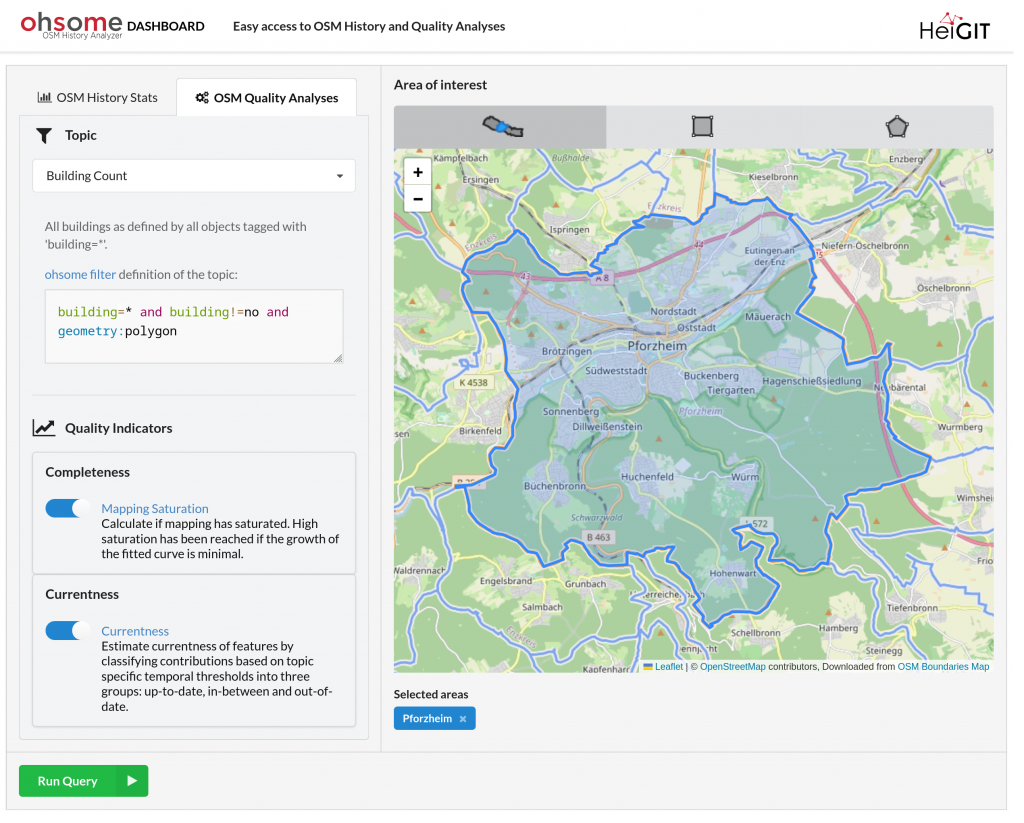
An additional incremental improvement to the dashboard involves the implementation of improved color differentiation for distinct administrative level boundaries. Also, the ohsome dashboard is now linked on the taginfo site (see upper right corner). Feel free to read our blogpost about it.
We are highly satisfied with the integration of an additional service focused on OSM quality analysis, known as the ohsome quality API (oqapi), into the ohsome dashboard, adding to OSM history stats (ohsome API). As a result of the sucessful integration and the existing robustness of the codebase, we are pleased to announce the launch of the ohsome dashboard version 1.0, which serves as both a testament to our confidence in the service’s value and quality and a reflection of our commitment to its continued enhancement.
Stable specification for the ohsome quality API
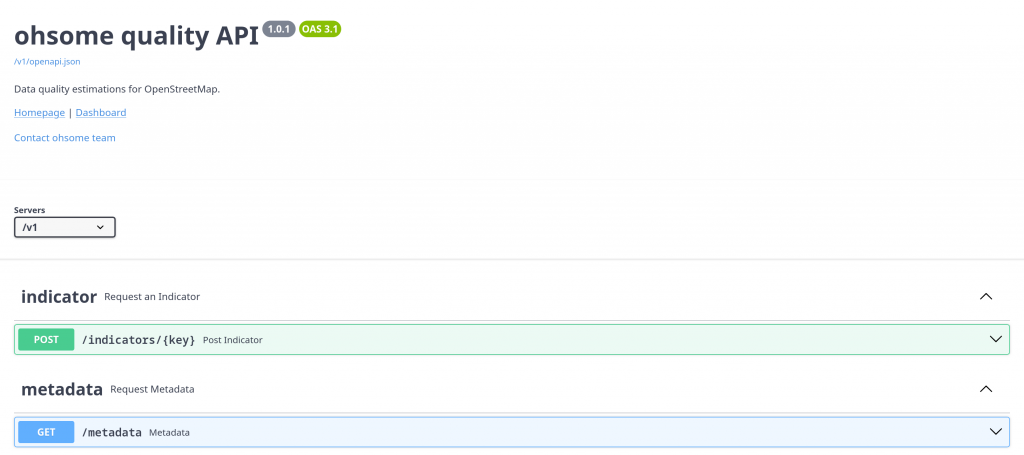
The scope of the API is defined quite well. There are two endpoints: One for retrieval of an indicator. One for retrieval of metadata about indicators, topics, quality dimensions and projects. Endpoints and parameters are defined in terms of the OpenAPI Specification (OAS). Using Swagger, an interactive and well documented interface to the API is generated. Examples of how to query the API in Python are available as Jupyter Notebooks here.
What comes next?
As we continue improving the robustness of our existing indicators soon, we will add new indicators as well. One of them will provide an estimation about the completeness of attributes. Comparison of OSM data with other datasets is also on our roadmap. So stay tuned.
Read related blogposts:
For any inquiries or questions pleas feel free to contact us via ohsome[at]heigit.org.