

The ohsome dashboard has been and continues to be an easy access point to generate accurate statistics about the historical development of OpenStreetMap data for arbitrary regions. Now, the ohsome dashboard got extended to be able to compute data quality metrics for OpenStreetMap through the ohsome quality analyst (OQT) which is also developed by HeiGIT. The source code is now available on GitHub and licensed under GNU GPLv3.
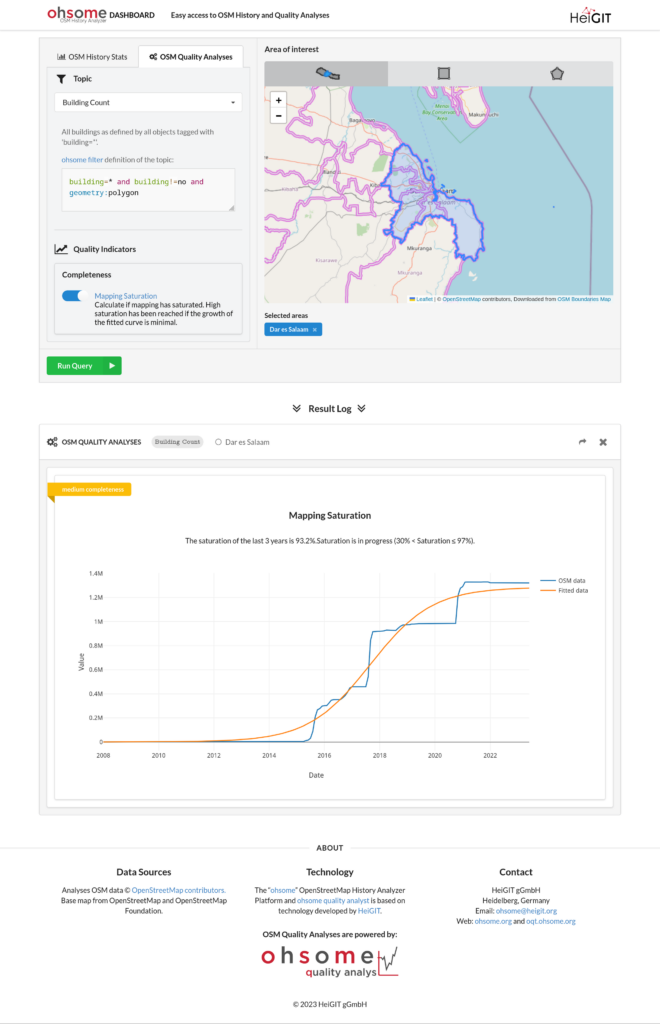
Now, the ohsome dashboard allows generating and displaying quality indicators for arbitrary regions through an easy-to-access web interface, which can be see above. Whereas previously, computing quality indicators required programming skills to make requests to the OQT API.
Other improvements of the ohsome dashboard include:
- New and up-to-date OSM administrative boundaries (level 7 and 8) are now available. For more details, please take a look at the OSM Wiki.
- Permalinks: Want to share a particular query and its results? Thanks to permalinks, this is now possible. Just run your query, copy the URL using the share button and send it off.
- Various bug fixes.
Upcoming
Currently, only one quality indicator can be computed through the ohsome dashboard: An estimation of the completeness of OSM by looking at the saturation of mapping activity, called Mapping Saturation indicator. Very soon, metrics about the up-to-dateness of features and the completeness of attributes will be available through the ohsome dashboard.
Check out our recent blogposts on OQT and OSM data quality analysis.
You are welcome to send us any feedback via GitHub issues or E-Mail (ohsome@heigit.org).