
Search results for: “ohsome api”
-
The Ohsome API: dynamic OSM statistics for real-world applications
The Ohsome API, developed at HeiGIT, is part of the ohsome OSM history analytics platform (and yes, it is pronounced like the word “awesome” 😉. It serves as the connection between the OpenStreetMap History Database (OSHDB) and possible frontends, such as the Ohsome Nepal Dashboard prototype. The communication with the Ohsome API works via HTTP GET and POST requests as…
-
Version 1.0 of the ohsome quality API and ohsome dashboard
At HeiGIT and in particular within the ohsome team, we strive to provide valuable insights into OpenStreetMap (OSM) data. The ohsome API offers aggregated statistics on the evolution of OSM elements since 2020. These are made easily accessible by the ohsome dashboard. With the ohsome quality API, previously called ohsome quality analyst (OQT), we continue…
-
Visualizing OQT API Results in QGIS
Using the ohsome dashboard, it is possible to explore quality estimation for OpenStreetMap (OSM) data from the ohsome quality analyst (OQT) for arbitrary regions. Also, OQT does provide an API to programmatically fetch quality estimation for a lot of different regions in one request. Chances are that one wants to visualize the results on a…
-

Introducing ohsomeNow stats: Real-Time Monitoring for OpenStreetMap Contributions
You can now monitor contributions to OpenStreetMap (OSM) in real time with ohsomeNow stats! We developed this new dashboard as part of our long-term cooperation with the Humanitarian OpenStreetMap Team (HOT), an international organization dedicated to humanitarian action and community development through open mapping. This dashboard replaces the Missing Maps Leaderboard with a comprehensive overview of…
-
Integration of OQT into the ohsome dashboard: Computing data quality metrics for OpenStreetMap
The ohsome dashboard has been and continues to be an easy access point to generate accurate statistics about the historical development of OpenStreetMap data for arbitrary regions. Now, the ohsome dashboard got extended to be able to compute data quality metrics for OpenStreetMap through the ohsome quality analyst (OQT) which is also developed by HeiGIT. The source code is now…
-
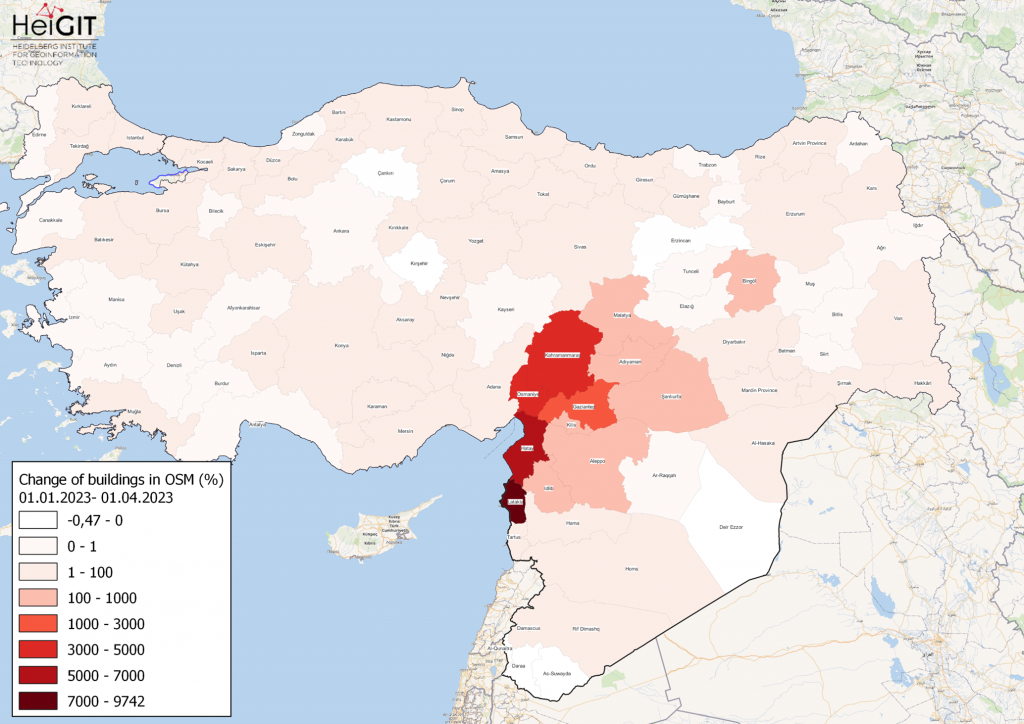
How to become ohsome part 15- Analysing Changes in OSM after the Earthquake in Syria and Türkiye in February 2023
Featured Map: Percent change in each province of Türkiye and Syria of buildings in OSM. Data from OpenStreetMap, visualized using QGIS and the ohsome API plugin. Welcome back to the how to become ohsome series! If you’re new to the series, you can check out the previous issues (like this one) or the ohsome Region of…
-
ohsome Region of the month – Temporal OSM developments in Kyiv
Welcome back to our ohsome region of the month series! In this post, we’ll take a look at the temporal development of highways and added smoothness-information, as well as social facilities and updates on map development for Kyiv. Before we start, if you’re new to the series, make sure to check out previous installments of…
-
ohsomeHeX with Quality indication from OQT
The HeiGIT team had a great time at the State of the Map 2022 in Florence. Many thanks to the participants for the fruitful discussions at our workshop! Despite the direct use of OSM as a map, more and more organizations use OSM as a source of data for activities, services, or applications. “How good…
-
New feature addition to Ohsome Quality analysT: Building Completeness Indicator
Introduction Since the release of the ohsome quality analyst (short OQT) in February of last year, we have been working on developing an accessible yet powerful toolkit which provides end users insights on the quality of OpenStreetMap (OSM) data. An overview of the functionality additions made to OQT over this period of time can be found…
-
How to become ohsome part 14 – Advanced dashboarding
Hello again and welcome back to our “How to become ohsome” series where we demonstrate how you too can become ohsome with ohsome API! If you’re new to the series or need a refresher, check out the older installments in our series, like this or this one covering the various ways of accessing ohsome API. And now to our…
-
How to become ohsome part 13 – An ohsome way to check if OSM is up to date
At long last, welcome to another addition of our How to become ohsome-series! This one is special because we’re discussing a third-party application that uses ohsome API as back-end to accumulate historical OSM data. Although this innovation isn’t directly about our API, it’s close enough (and exciting enough) to merit inclusion and just one more opportunity for…
-
ohsome Region of the Month: hiking-related tags & mountains
Welcome back to a new installment of the ohsome Region of the Month blog series! This will be part two our posts on hiking related tags and this time, we’ll investigate the connection between user activity and said tags. To do this, we’ll use mountain time as a reference area and incorporate insights from part one…