

Hello again and welcome back to our “How to become ohsome” series where we demonstrate how you too can become ohsome with ohsome API! If you’re new to the series or need a refresher, check out the older installments in our series, like this or this one covering the various ways of accessing ohsome API.
And now to our current blog post!
This time, you’ll be introduced to a tool that has yet to be mentioned in this series. We’re talking about the super convenient and extremely intuitive ohsome Dashboard.
Our ohsome dashboard’s main plus is that it boasts more of an interface than other tools. All you have to do is tell the dashboard what you’d like, so there’s no need for you to get your input boundary file. Instead, simply use the map given on the right site of the interface. Then you can address which filter you would like to use as well as your temporal resolution of choice. Once you set the dashboard parameters to everything you need (e.g. groupBy) the only thing left to do is hit the “Send Request“-button and wait for your output data. Whilst the ohsome Dashboard will also display your output in a figure on the page itself, you can of course download your dataset to keep working on it as either an ohsome JSON or CSV file.
Why highlight the dashboard now, though? Well, we launched an exciting recent update with advanced filter settings that allow you to discover more complex filters!
Before, you were limited to only selecting one key=value pair. Now, you can do everything you would with your typical ohsome request. With the selector logic, you can analyze whatever you want within the scope of OpenStreetMap objects. There are no limits to your historical data accumulation except that it should be within the existing temporal scope of OSM.
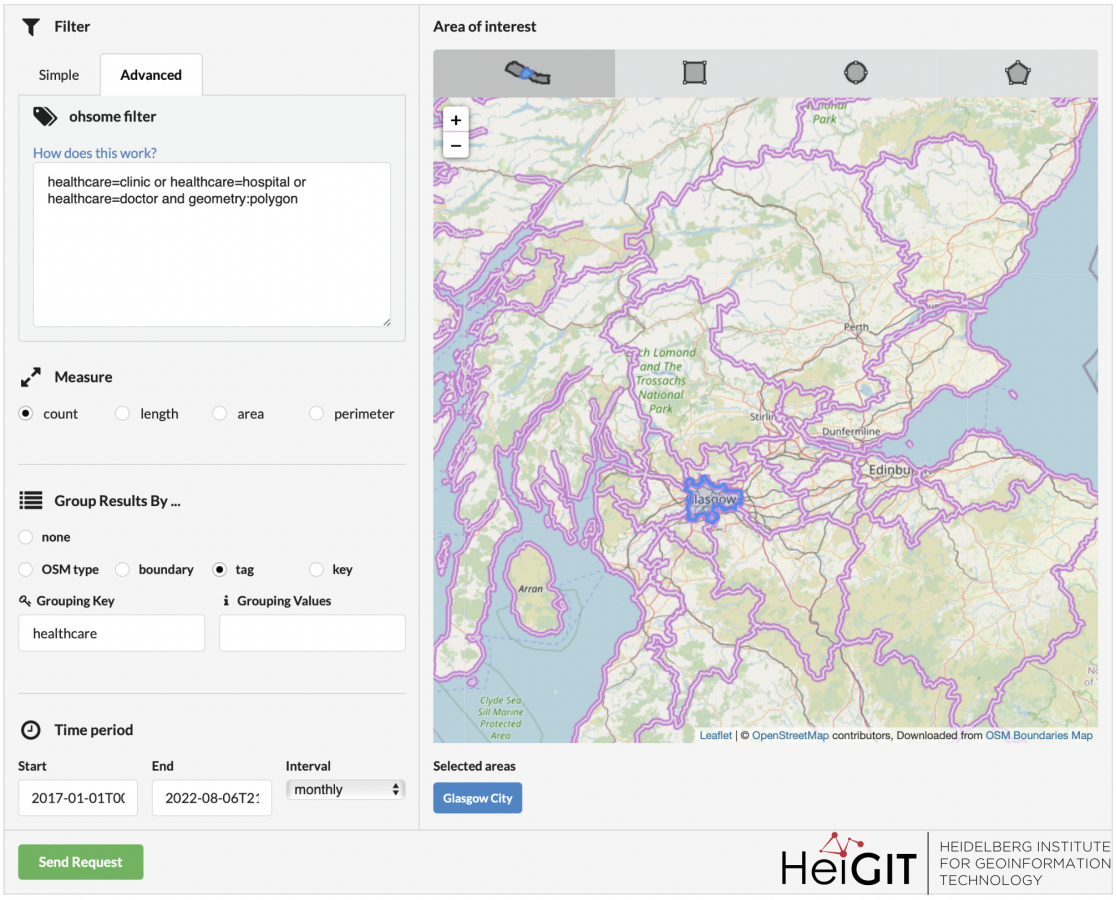
We’ll now give you a short introduction to working with the ohsome dashboard with the new advanced filter options. For this, we came up with two easy examples. As you can simply choose your input boundary in the map on the right, there is no need for you to find an input dataset as you usually would. Convenient, right? The next step for your dashboard request would be to set a filter choose the appropriate type of output data.
Examples
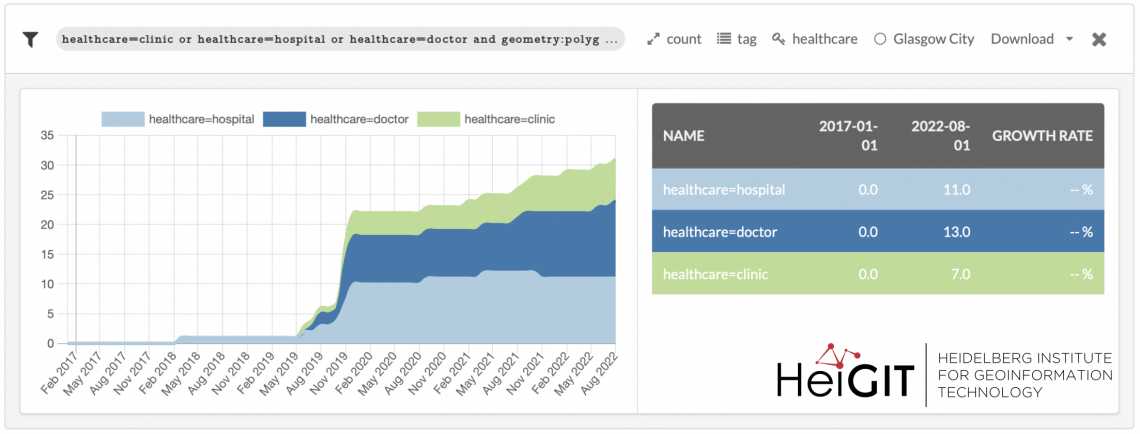
In our first example, we want to request the count of objects in Glasgow tagged with either healthcare=hospital, healthcare=clinic or healthcare=doctor and the geometry type polygon between 2017-01-01 and 2022-08-06 with a monthly resolution. Furthermore, we want the output values grouped by their individual tags so one can see the individual development of the tags.
We ended up with the following result:
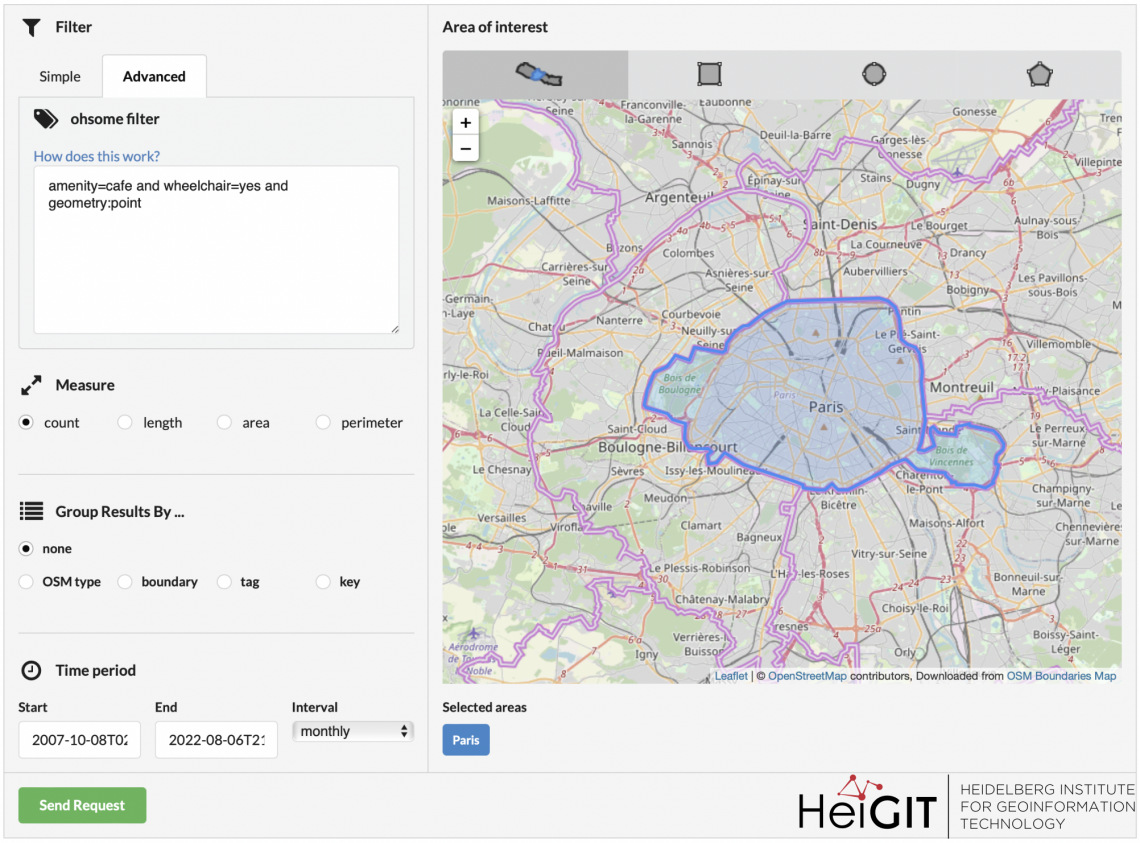
The second example is all about cafe accessibility in Paris. We wish to analyze the development of the amount of objects with two tags, amenity=cafe and wheelchair=yes, and the geometry type point. For this, the timespan 2007-10-08 until 2022-08-06 and a monthly interval were chosen.
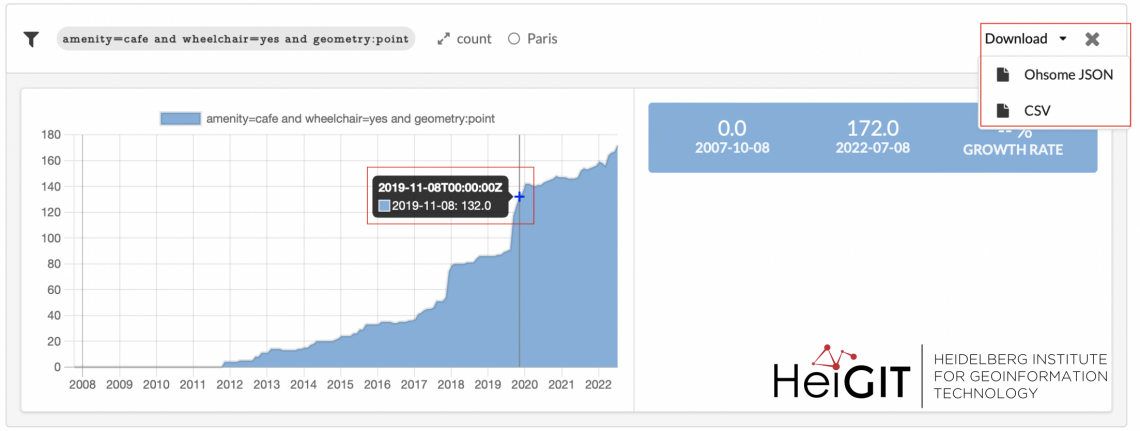
In the figure below, you can see the results as well as another neat feature of ohsome Dashboard in the little red box on the left. Move your pointer across the graph and get information as to the value on a certain date. Additionally, the red box on the right shows you how to download your output dataset. These examples provide a brief look into your data and help to decide whether the data would be suited for potential further analysis.
Generally, that’s everything you need to know, if you would like to explore data using the ohsome Dashboard.
Thank you for reading our newest “How to become ohsome” blog post and staying up to date with what’s new in our ohsome world! We hope you liked this addition and found it helpful. Stay tuned until next time!
Background info: the aim of the ohsome OpenStreetMap History Data Analytics Platform is to make OpenStreetMap’s full-history data more easily accessible for various kinds of OSM data analytics tasks, such as data quality analysis, on a regional, country-wide, or global scale. The ohsome API is one of its components, providing free and easy access to some of the functionalities of the ohsome platform via HTTP requests. Some intro can be found here:
- ohsome general idea
- ohsome general architecture
- OSM element vectorisation