

Welcome back to our ohsome region of the month series! In this post, we’ll take a look at the temporal development of highways and added smoothness-information, as well as social facilities and updates on map development for Kyiv. Before we start, if you’re new to the series, make sure to check out previous installments of the series such as this one, which also deals with the highway tag, or this one about forests in Canada. For now, let’s take a look at Kyiv’s highways and social facilities.
Data & Requests
As usual, our input boundary was extracted here in GeoJSON format. For our requests, we’ve decided to do a long-term request as well as a short-term request for each endpoint used. The following filter conditions were set.
Social Facilities:
filter = type:way and social_facility=*
filter2=type:way and social_facility=* and social_facility:for=*
time = 2022-01-01/2022-09-01/P1D; 2012-01-01/2022-09-01/P2W
endpoint = elements/area/ratio
Highways:
filter = type:way and highway=*
filter2=type:way and highway=* and smoothness=*
time = 2022-01-01/2022-09-01/P1D; 2012-01-01/2022-09-01/P2W
endpoint = elements/length/ratio
When sending a ratio-request, you’ll get three different columns of data – one for each filter and a third with the ratio values. After setting these values, we created the following figures.
Social Facilities

The figure above shows both the long-term (left) development of ratio values for objects tagged with social_facility=*and social_facility=* and social_facility:for=* as well as the short-term development (right) since January of this year. Overall, there were no values available until June of 2018, yet most of the added social_facility=* objects did have their purpose (social_facility:for=*) updated right away. An increase took place during the second half of 2019 and another during the second half of 2021. Except for a slight increase around February 2022, values were more or less stagnant until a small decrease during June. One trend to note is the increase of ratio during late August.
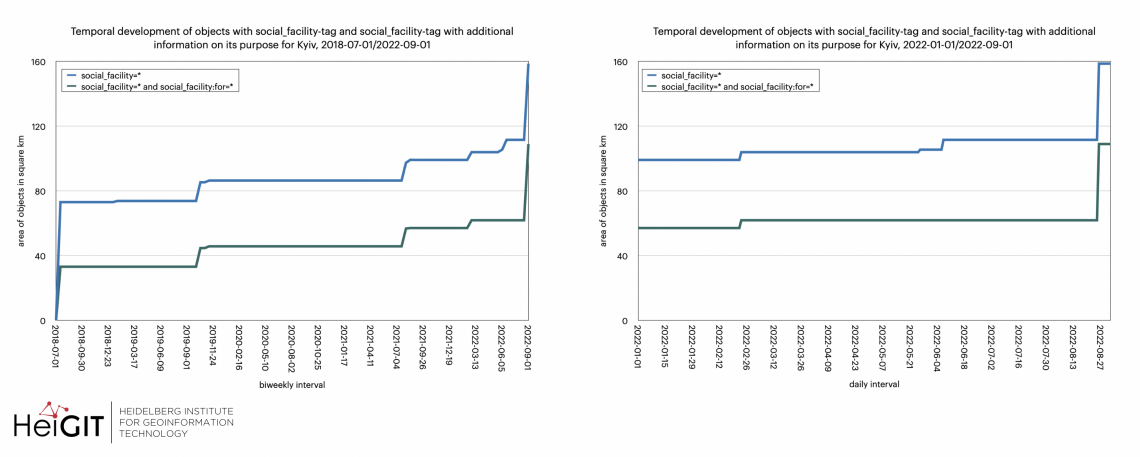
In the figures above you can see the temporal development of the tags themselves. Again, on the left side, the long-term development is depicted and on the right side you can see the development since January 2022. The output values are shown in area in km2. Generally, there is a quite similar temporal development for both filter-conditions, however, a few exceptions can be spotted. For example, there has been no increase in social_facility=* and social_facility:for=* between March and August 2022, although objects have been tagged with social_facility. A comparable occurrence can be found during the early months of 2019.
Highways
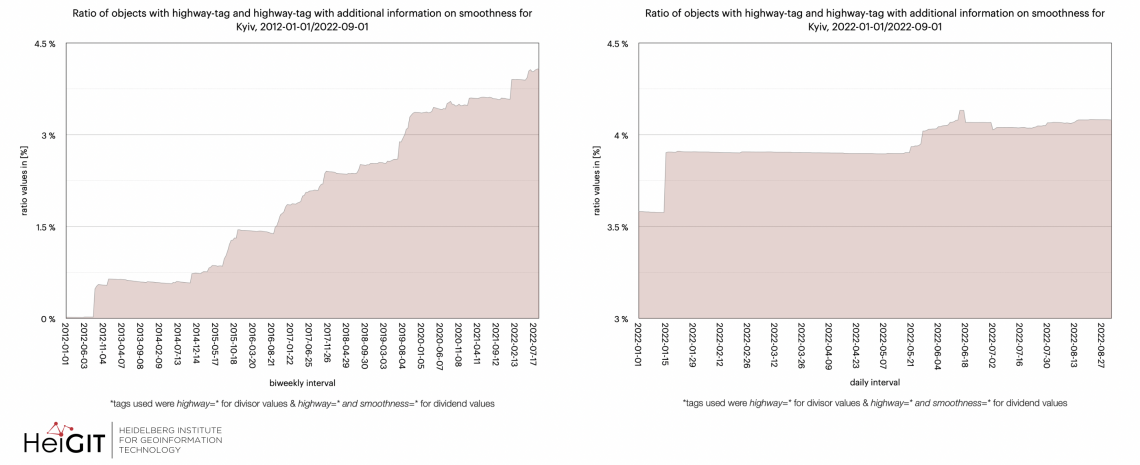
As in the first figure, the development of ratio values is plotted in the figure above for the ratio of highway=* and smoothness=* to highway=* in this graph. Long-term developments can be seen in the left graph and short-term developments within the right. Whilst social-facility development proceeds rather slowly, but with a high completeness, highway-smoothness ratio has been steadily increasing, but never reaching even 5% of all highway objects. There has been a notable increase mid-January 2022 after which development stagnated until the second half of May. Peaking in June, the ratio values slightly declined again in the second half of the year.
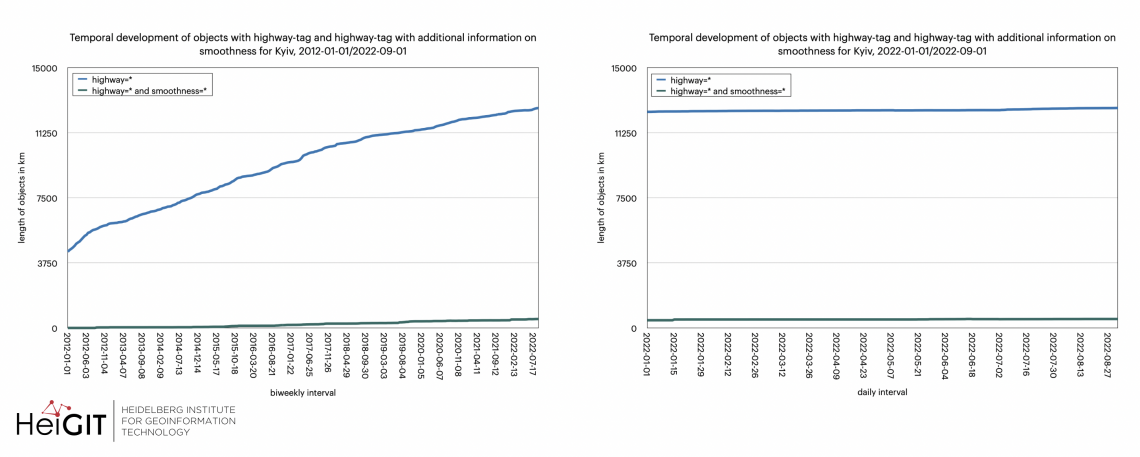
For a better visual on the development of both ratio components, temporal development is displayed in the figure above. There is a mostly steady increase in both cases, but highway=* shows a steeper slope and much higher values, as expected. In contrast to long-term development, values remain stagnant throughout 2022.
Ultimately, we see that there have been no major increases in the values for the highway tag over the course of this year. In the case of the social_facility-tag, this observation is less straightforward. Over the course of time, several data jumps are observed since January 2022, but always to a lesser extent than during the preceding time period, the exception being August. The first data jump in 2022 took place in the period from February 23 to February 24 during the same time as Russian troops invaded Ukraine. On May 26 and June 07, the values for social_facility-tags increased again. Among other events, the May 26 increase coincides with an attack on Kharkiv while the June 07 jump occurred during Pramila Patten’s speech at the 9056th meeting of the UN Security Council on Sexual Violence during the War. The most prominent increase takes place from August 25 to 26, at which time the nuclear power plant in Zaporizhzhia was also under reoccurring shelling. All of the above-mentioned reasons may be (though must not necessarily be) related to the observable jumps in the social_facility-tag. Future observing of the tag’s development and a closer examination of its tagging character may prove insightful.
Thank you for reading this post in our ohsome region of the month-series. Stay tuned for more news from the world of ohsome API.
If you wish to run the analysis on your own, you can check out this snippet and easily adjust the parameters. If you are curious as to how up-to-date the data of the OSHDB is, take a look at the metadata of the ohsome API. The “toTimestamp” attribute will tell you when the data was last updated.
Background info: the aim of the ohsome OpenStreetMap History Data Analytics Platform is to make OpenStreetMap’s full-history data more easily accessible for various kinds of OSM data analytics tasks, such as data quality analysis, on a regional, country-wide, or global scale. The ohsome API is one of its components, providing free and easy access to some of the functionalities of the ohsome platform via HTTP requests. Some intro can be found here:
- ohsome general idea
- ohsome general architecture
- OSM element vectorisation