

Category: Research
-
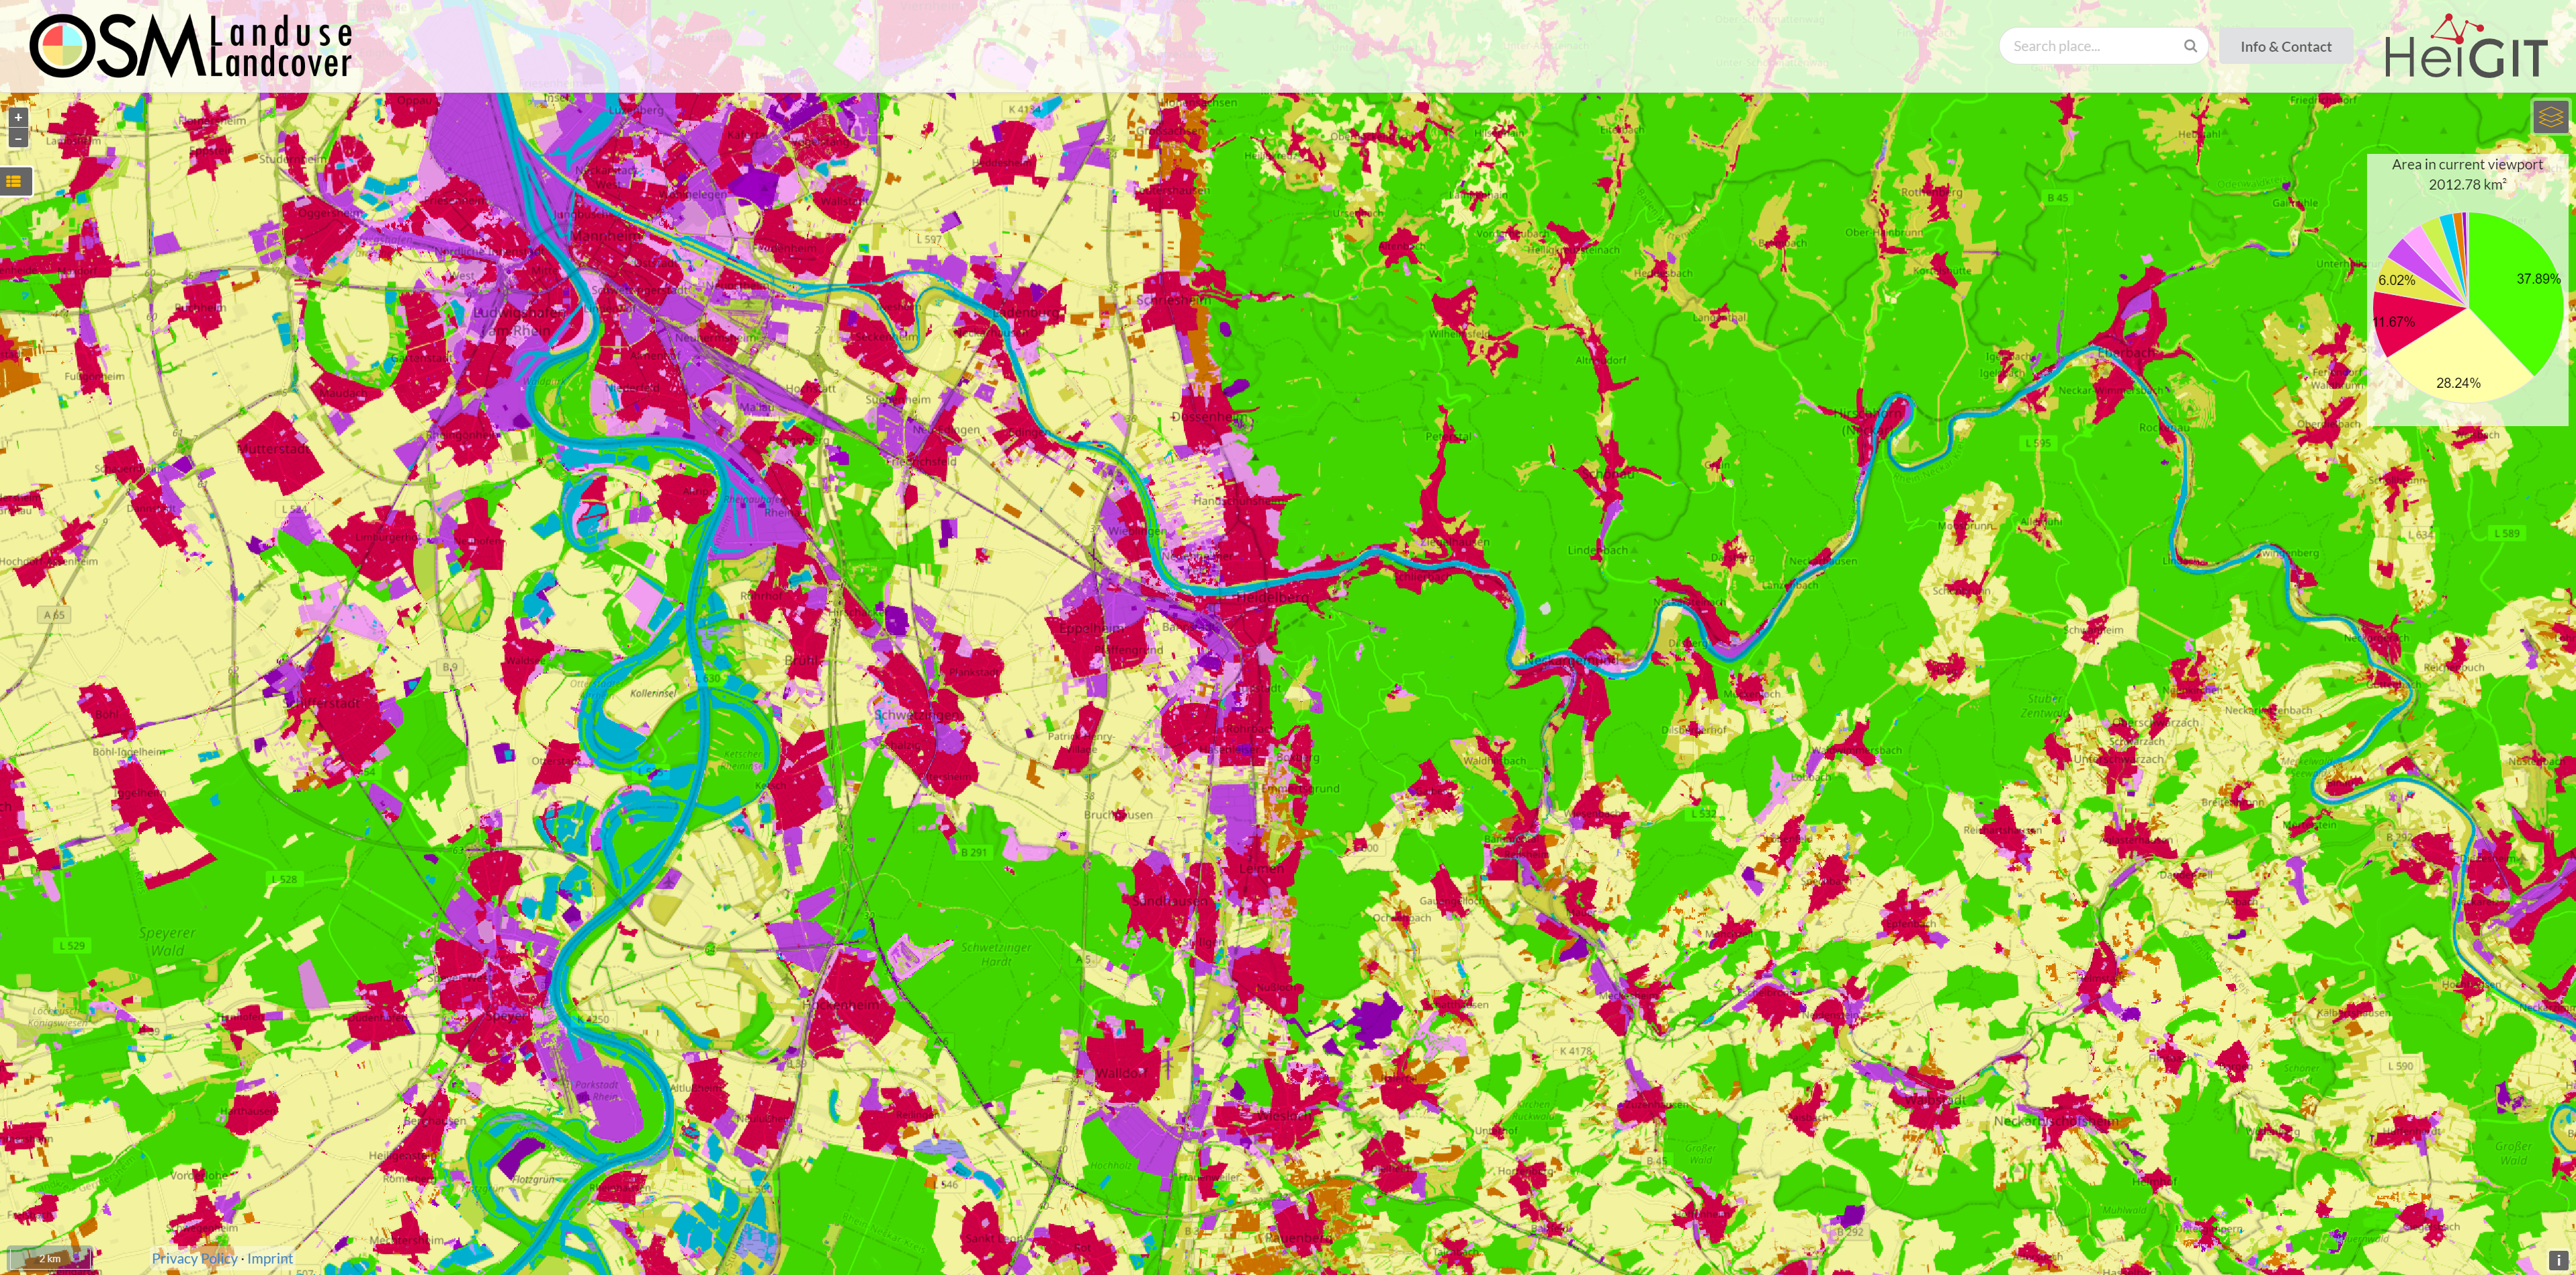
OSM Landuse Data is available in HeiData
We are excited to announce that the data displayed on OSM – Landuse is now freely accessible. These data sets offer valuable insights and can be utilized for various applications. Urban planners will find the data useful for development projects and zoning regulations, while environmental researchers can study land use changes and their impact on…
-
Call for Papers: Special Issue on Urban AI in Environment and Planning B
Together with collaborators from Urban Analytics Lab Singapore and CICI Lab, we are organising a special issue in Environment and Planning B: Urban Analytics and City Science, on the topic of Urban AI for a Sustainable Built Environment. Here is the summary of the call for papers: “Recently, Urban AI has become an emerging field…
-

Advancing Vector Control Through GeoAI: Insights from Steffen Knoblauch’s talk at The Program of Scientific Computing (PROCC) at FIOCRUZ
On May 15th, the Program of Scientific Computing (PROCC) at Fiocruz hosted Steffen Knoblauch, a GIScience Ph.D. candidate, for his presentation titled “GeoAI 4 Dengue: Harnessing Geospatial Big Data to Guide Vector Control.” This event, organized in partnership with The Global Health Network Latin America and the Caribbean (TGHN LAC), provided a platform for academic…
-
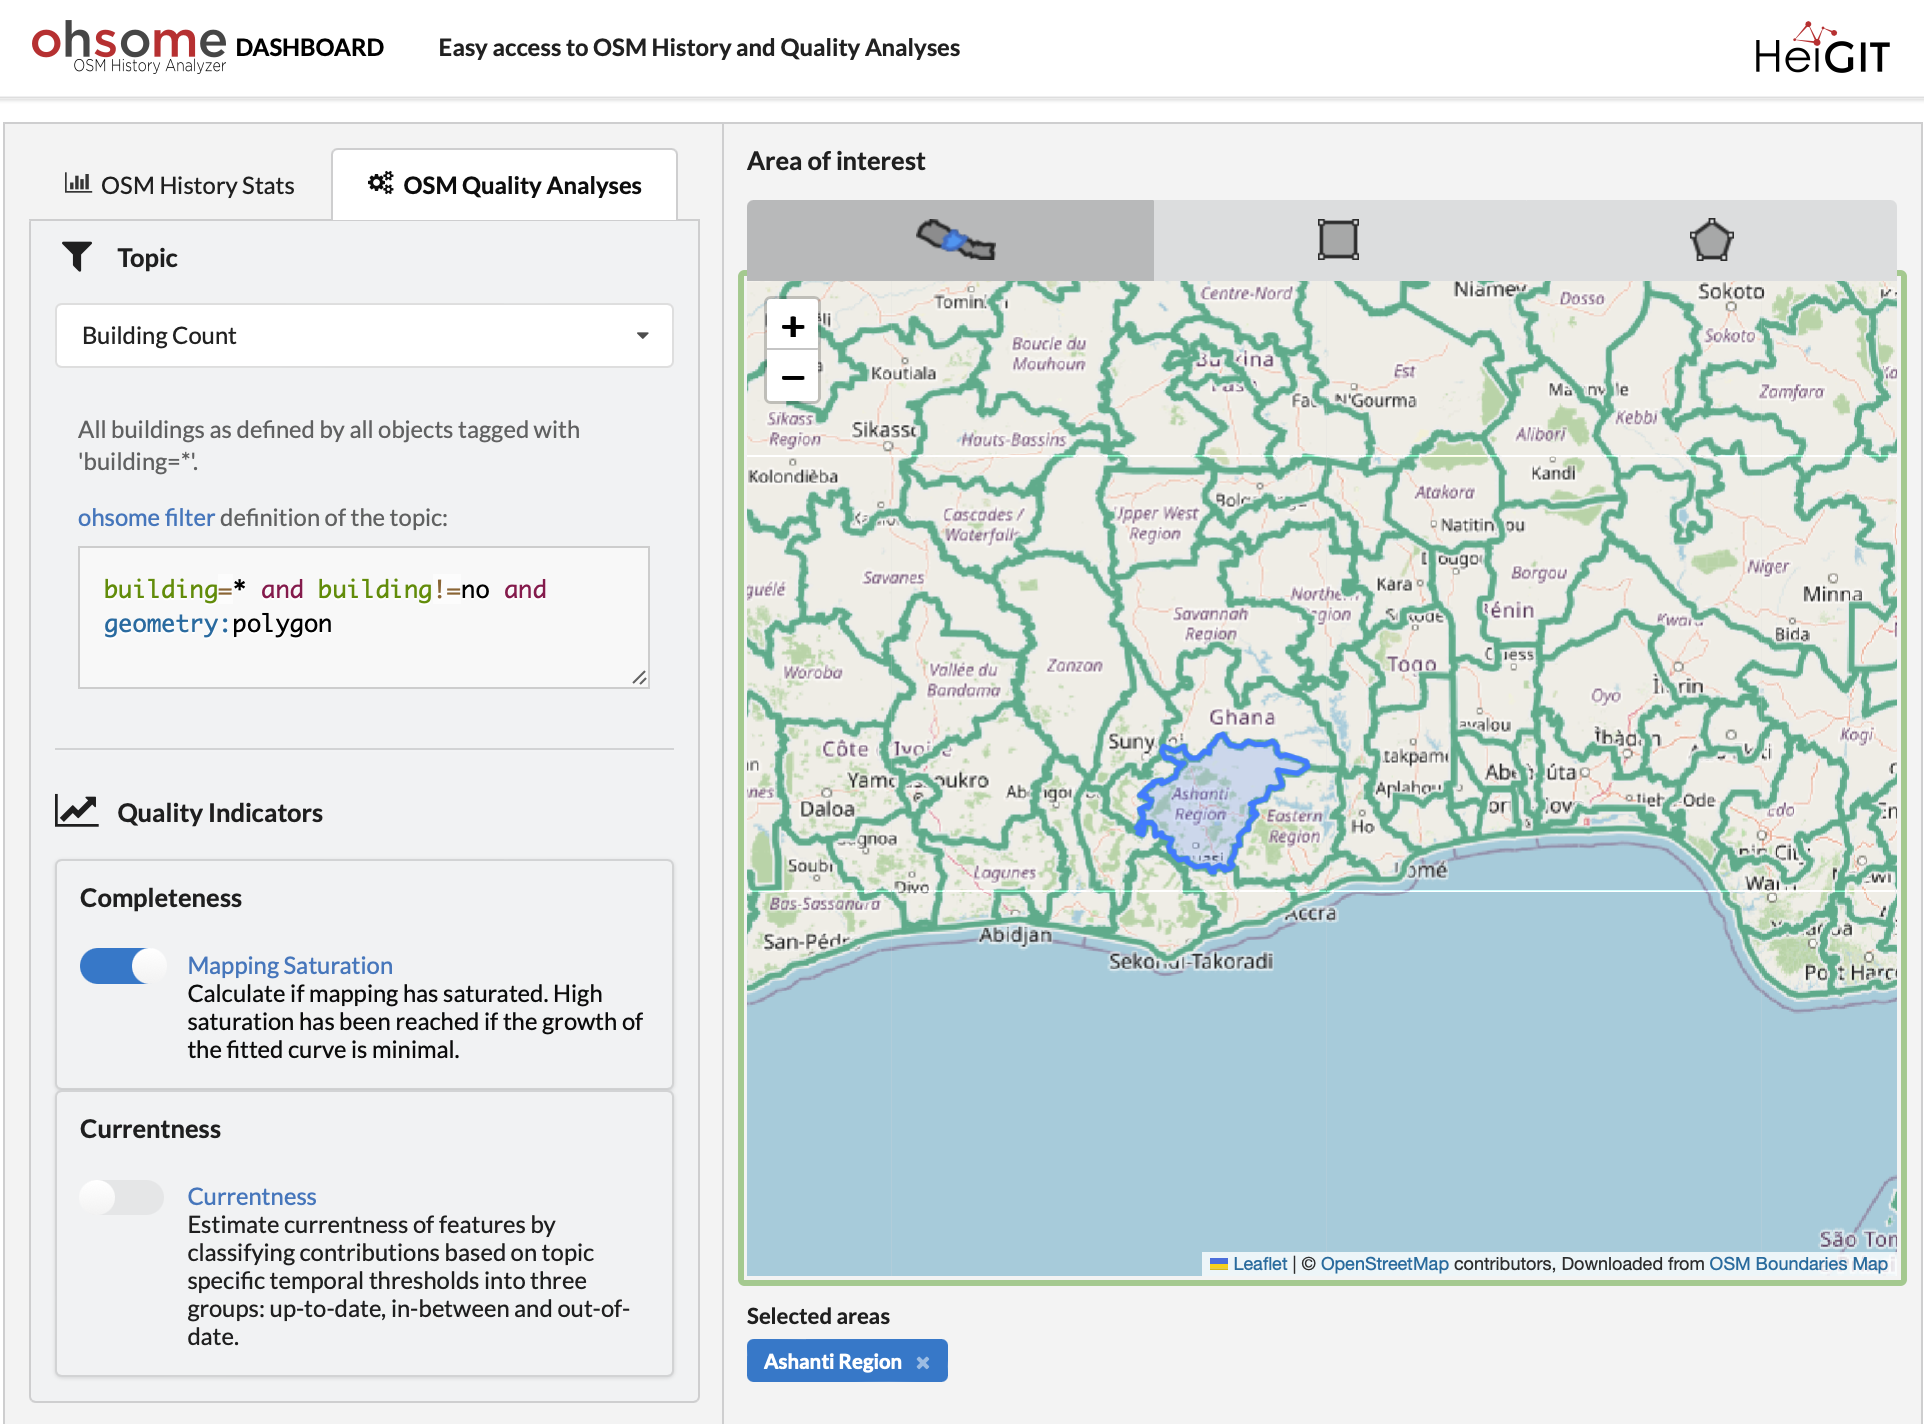
ohsome Quality API: New Features
Are you ready to take your OpenStreetMap (OSM) data analysis to the next level? We’re excited to showcase the latest features of our ohsome Dashboard, designed to provide you with insights into OSM data quality. With the ohsome Dashboard, analyzing OSM data has never been easier. Whether you’re interested in evaluating mapping saturation, currentness, or…
-
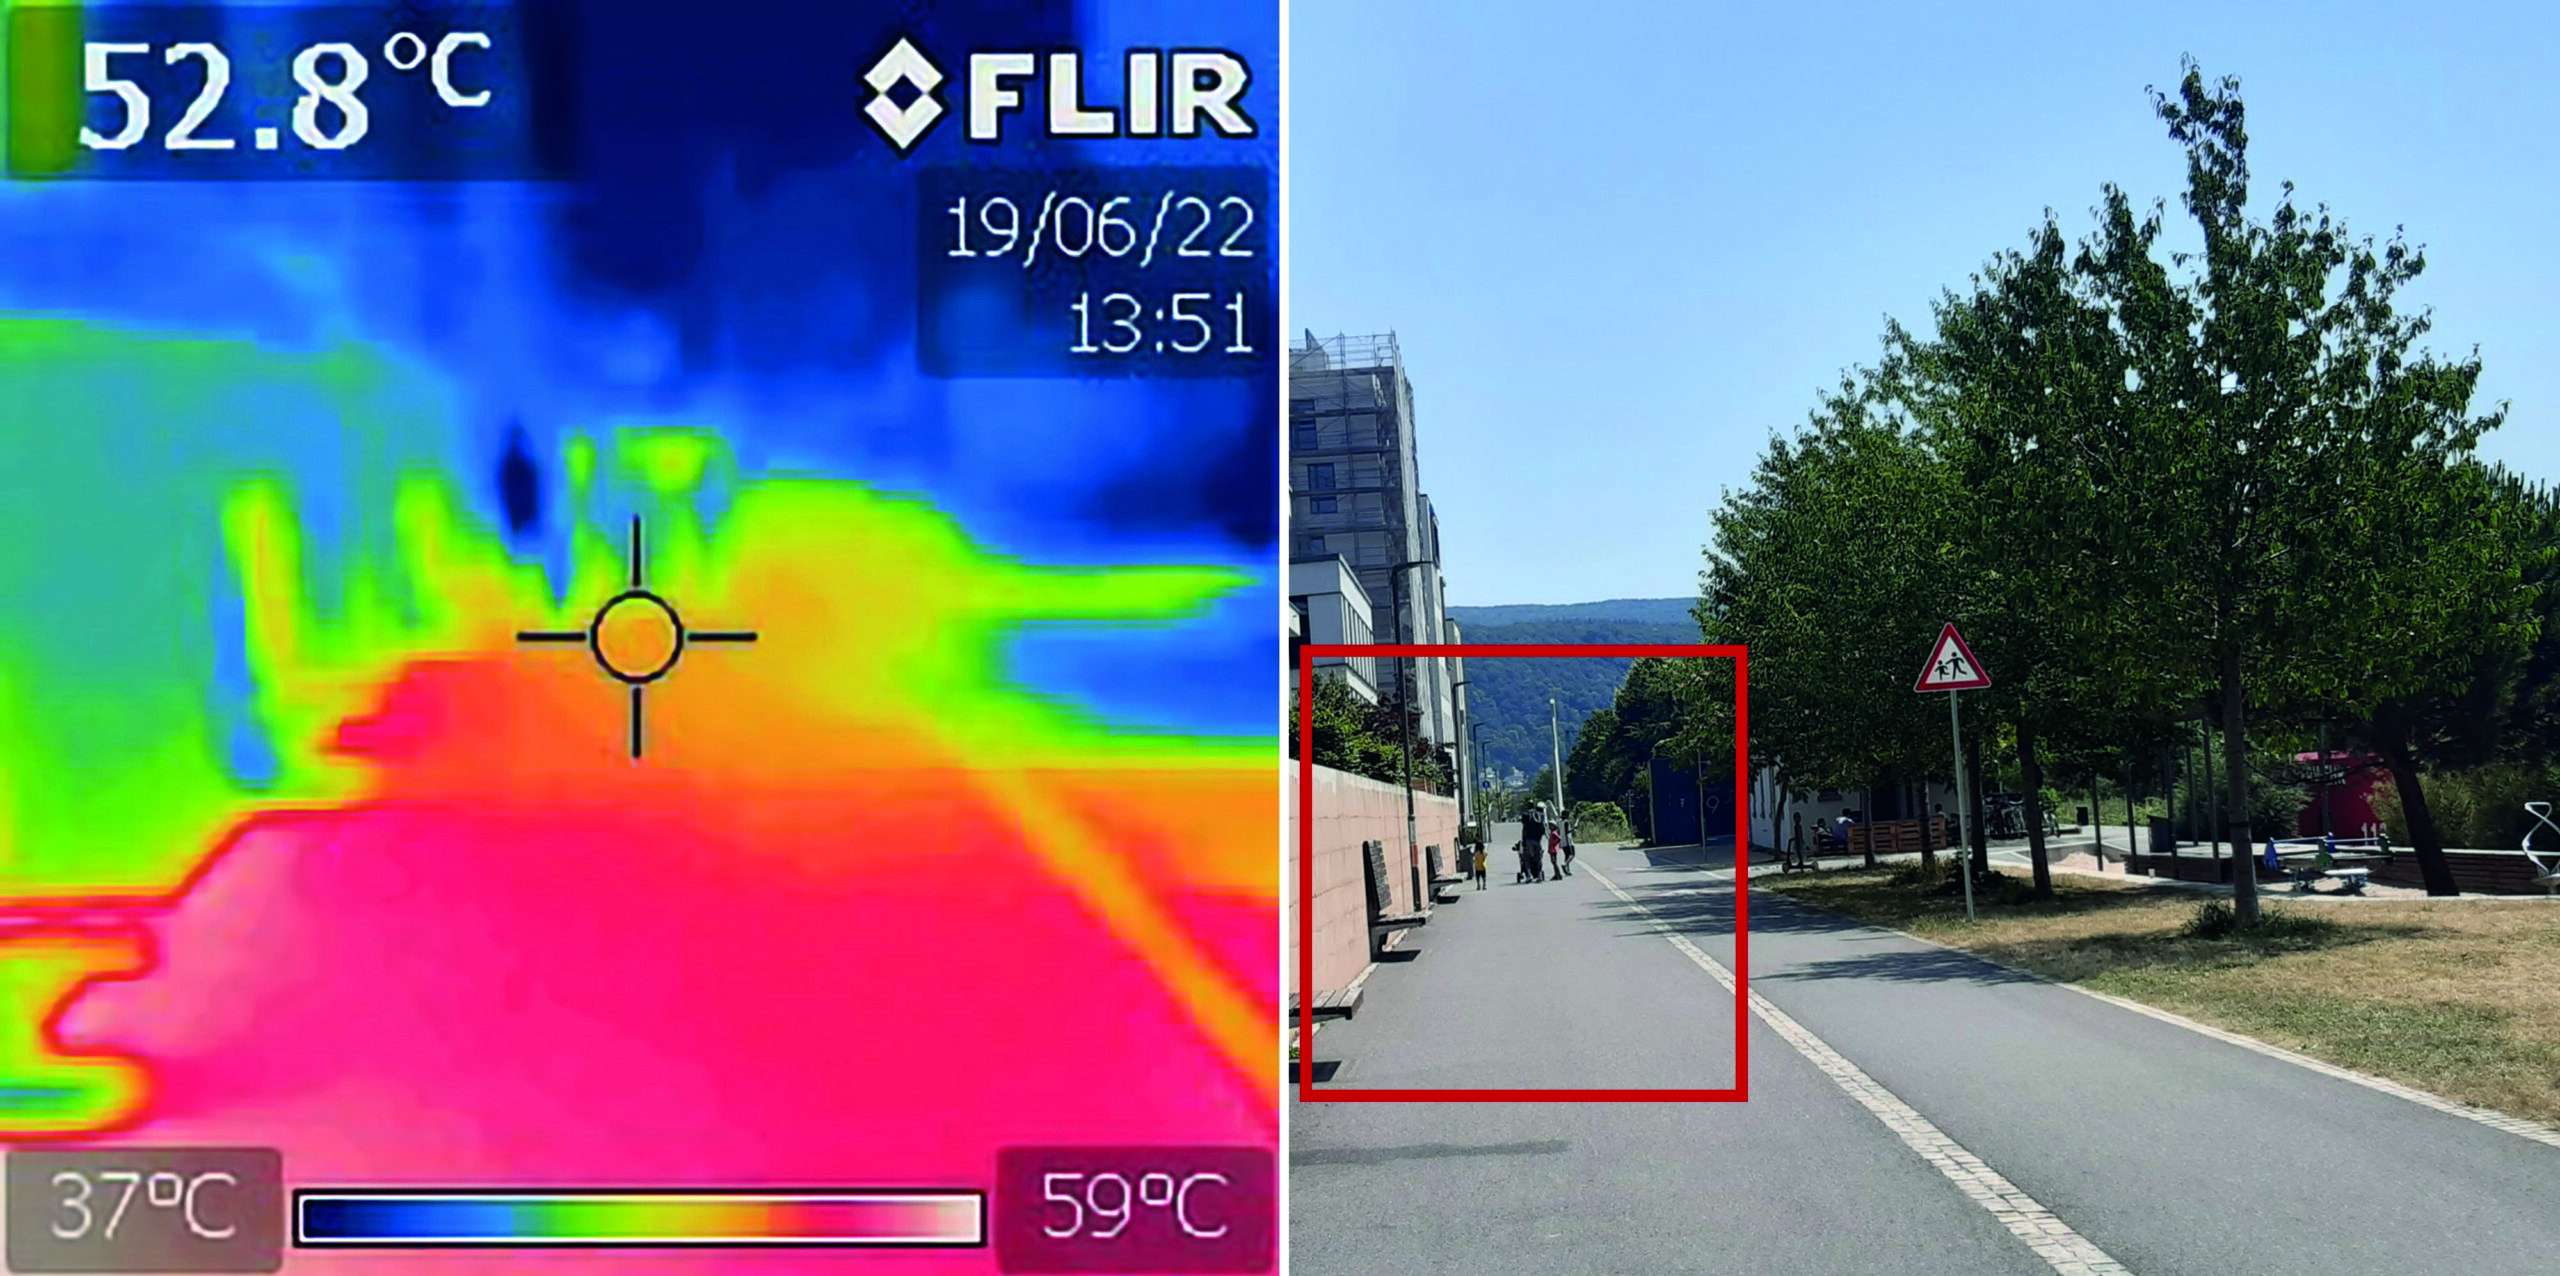
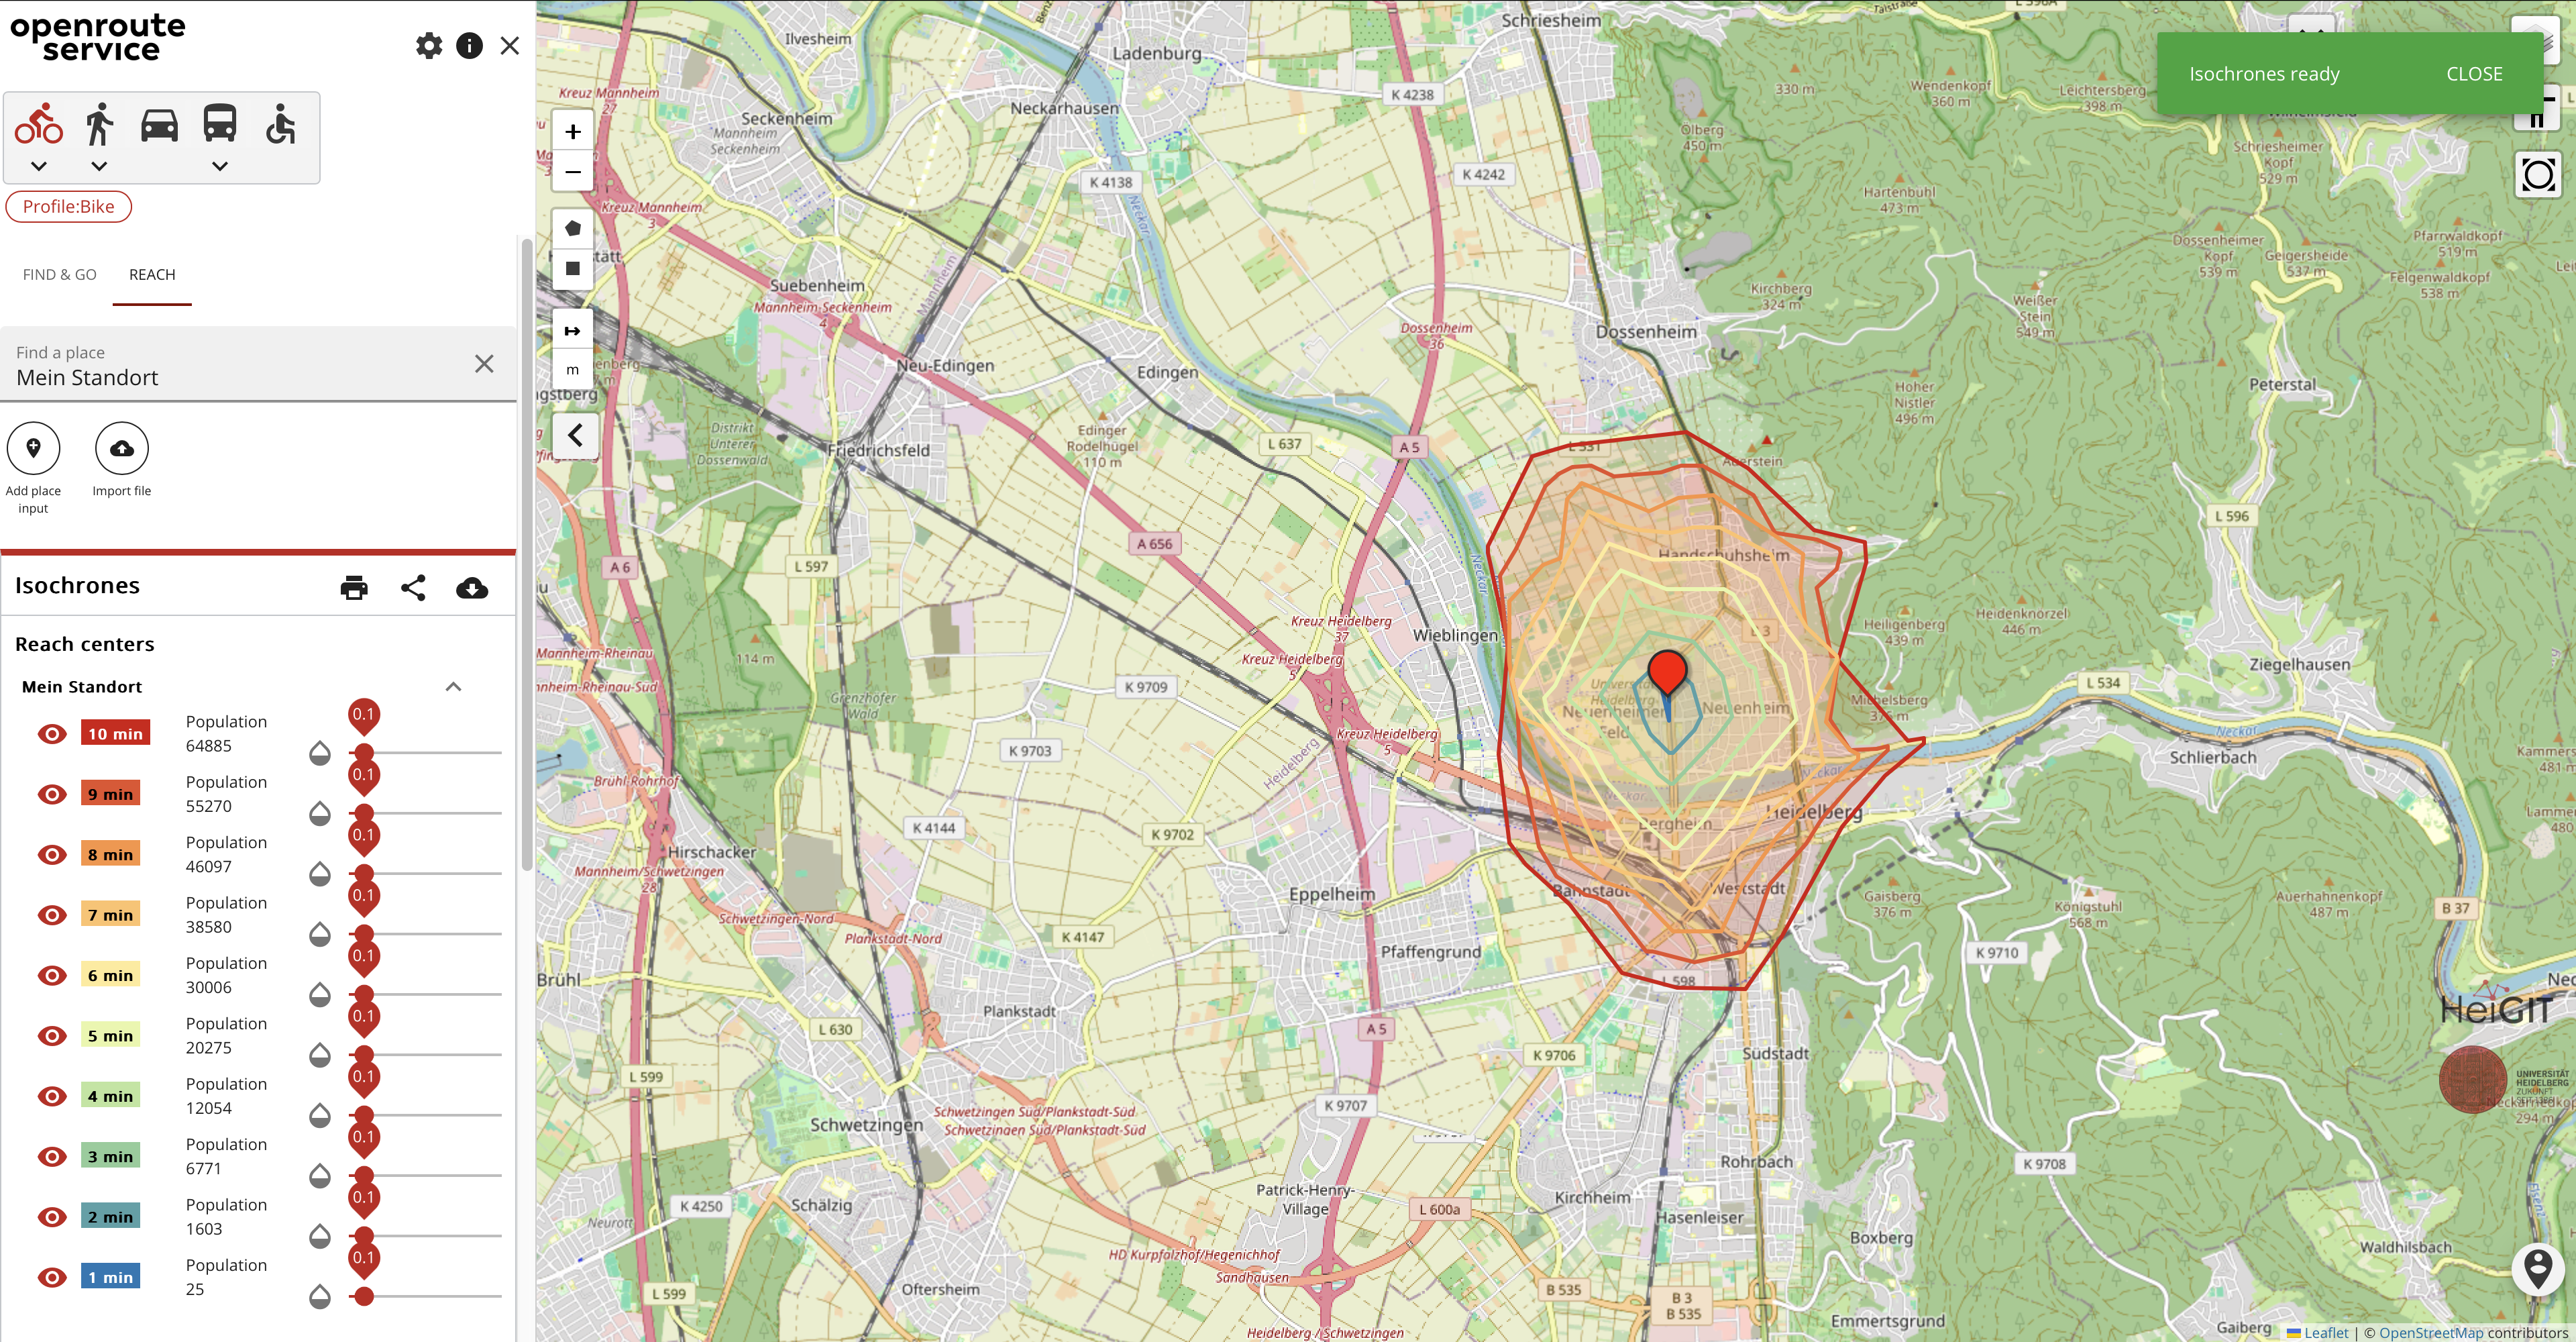
“How to assess the needs of vulnerable population groups towards heat-sensitive routing?”
The research team of the transdisciplinary project HEAL (Heat Adaptation for Vulnerable Population Groups), focusing on providing heat adaptation measures for vulnerable groups in Heidelberg, has published a research paper titled “How to assess the needs of vulnerable population groups towards heat-sensitive routing? An evidence-based and practical approach to reducing urban heat stress”. The paper…
-
Introducing openrouteservice version 8.0 — A dedication to Wilfried Juling
We’re thrilled to announce the release of openrouteservice (ors) version 8.0, designated “Wilfried”, as a tribute to Prof. Dr. Wilfried Juling, whose steady support and advice fundamentally shaped the growth and success of HeiGIT since its beginning. With countless hours and dedication poured into development and innovation, we’re excited to present a rich set of…
-
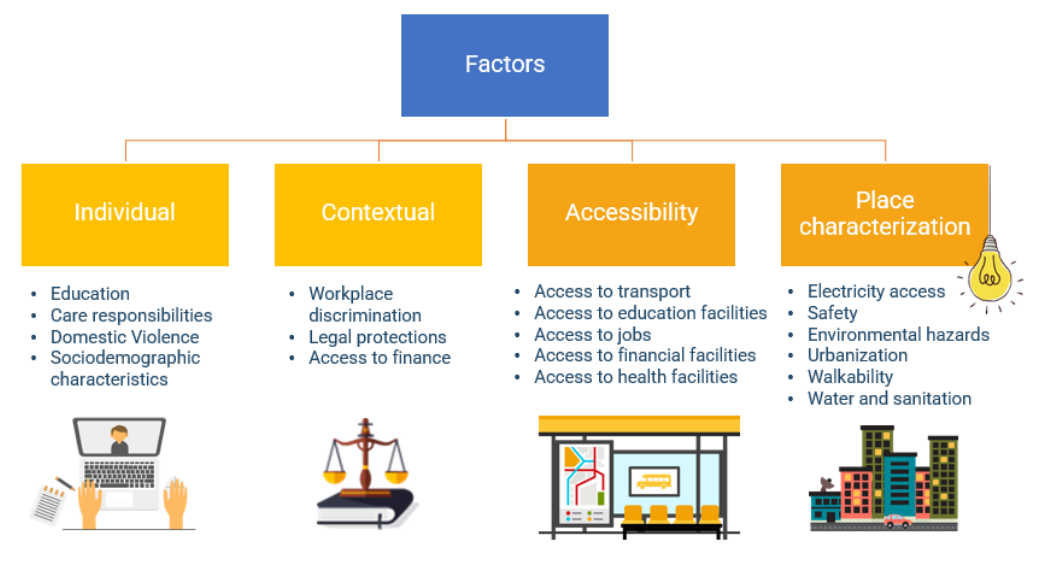
Empowering Change: OpenRouteService in Geospatial Initiatives for Women’s Economic Empowerment and Sustainable Development
The use of open-source geospatial data, exemplified by services like openrouteservice (ORS), proves to be beneficial for both academic research and use case studies. Witnessing our technologies applied in unanticipated ways showcases their potential to meet the evolving needs of various sectors while contributing positively to both society and the environment. One exemplary application is…
-
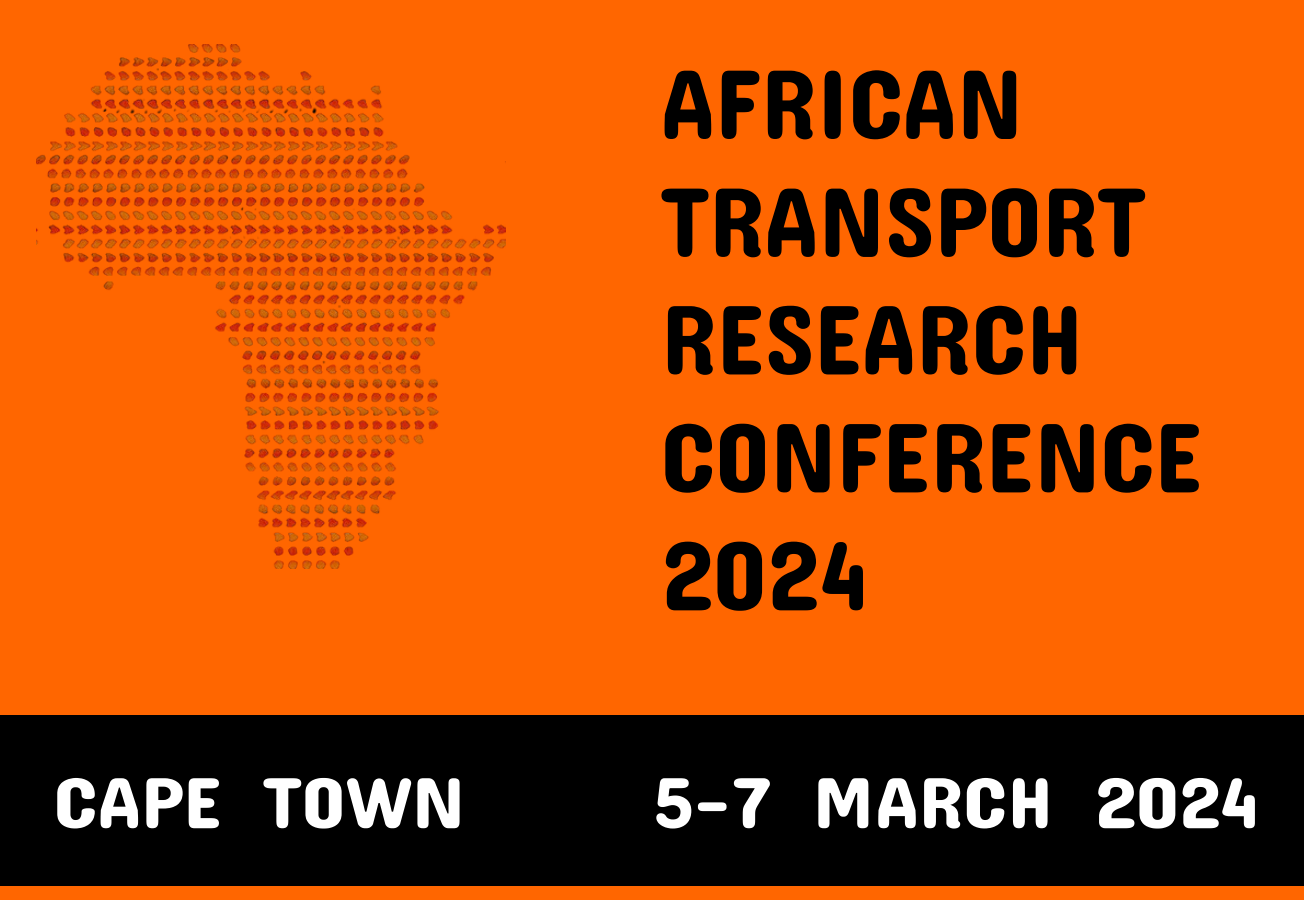
Unveiling the Impact of School Commutes: Charles Hatfield Presents Insights on Traffic Congestion and Urban Planning at ATRC 2024
Charles Hatfield will represent HeiGIT at the first ever African Transport Research Conference (ATRC 2024) which takes place from March 5-7 in Capetown, South Afrika. The conference was established to address rapid urbanisation in Africa and the corresponding challenges for transport and infrastructure. Volvo Research and Educational Foundations (VREF) and the Centre for Transport Studies…
-

VirtuaLearn3D: New Preprint
We have published a preprint of our recent work in the VirtuaLearn3D project! Deep learning with simulated laser scanning data for 3D point cloud classification Esmorís, A.M., Weiser, H., Winiwarter, L., Cabaleiro, J.C. & Höfle, B. (2024) Laser scanning is an active remote sensing technique to acquire state-of-the-art spatial measurements in the form of 3D…
-
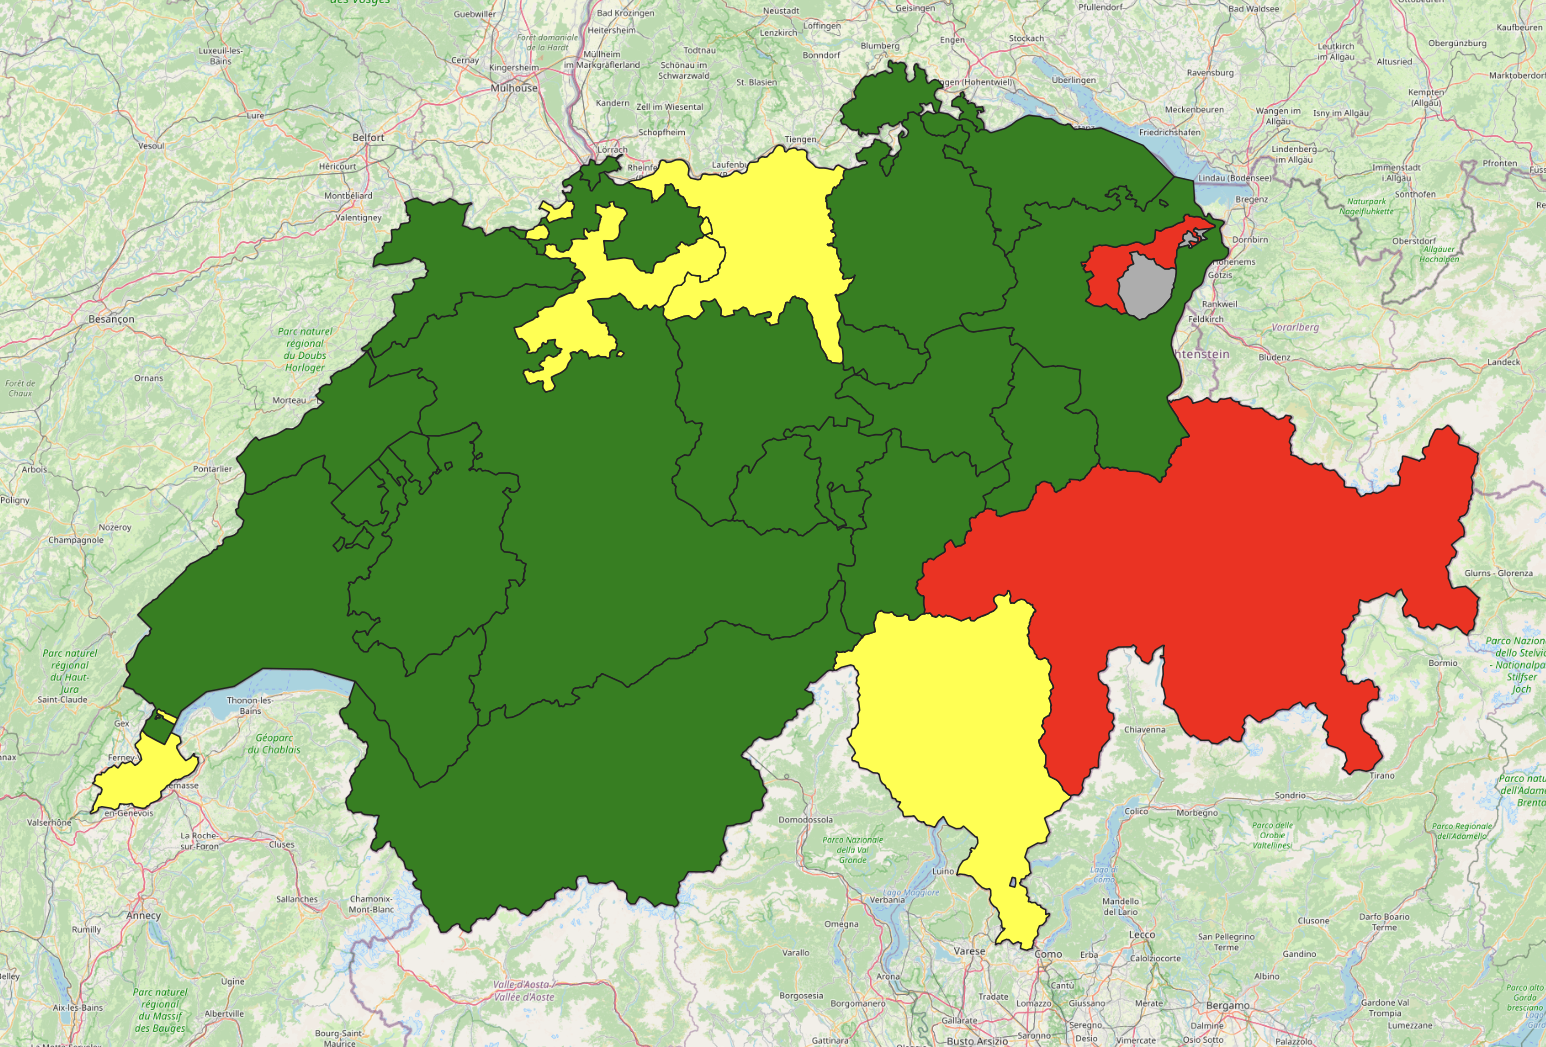
OQT for Food Environments
HeiGIT and the Amsterdam University Medical Centers (UMC) partnered up to investigate food environments through the lens of OpenStreetMap (OSM) data. UMC analyses how exposure to different categories of food related retailers affects health matters. The assumption is that the distance to retailers of a certain category, as well as the number of these retailers,…
-
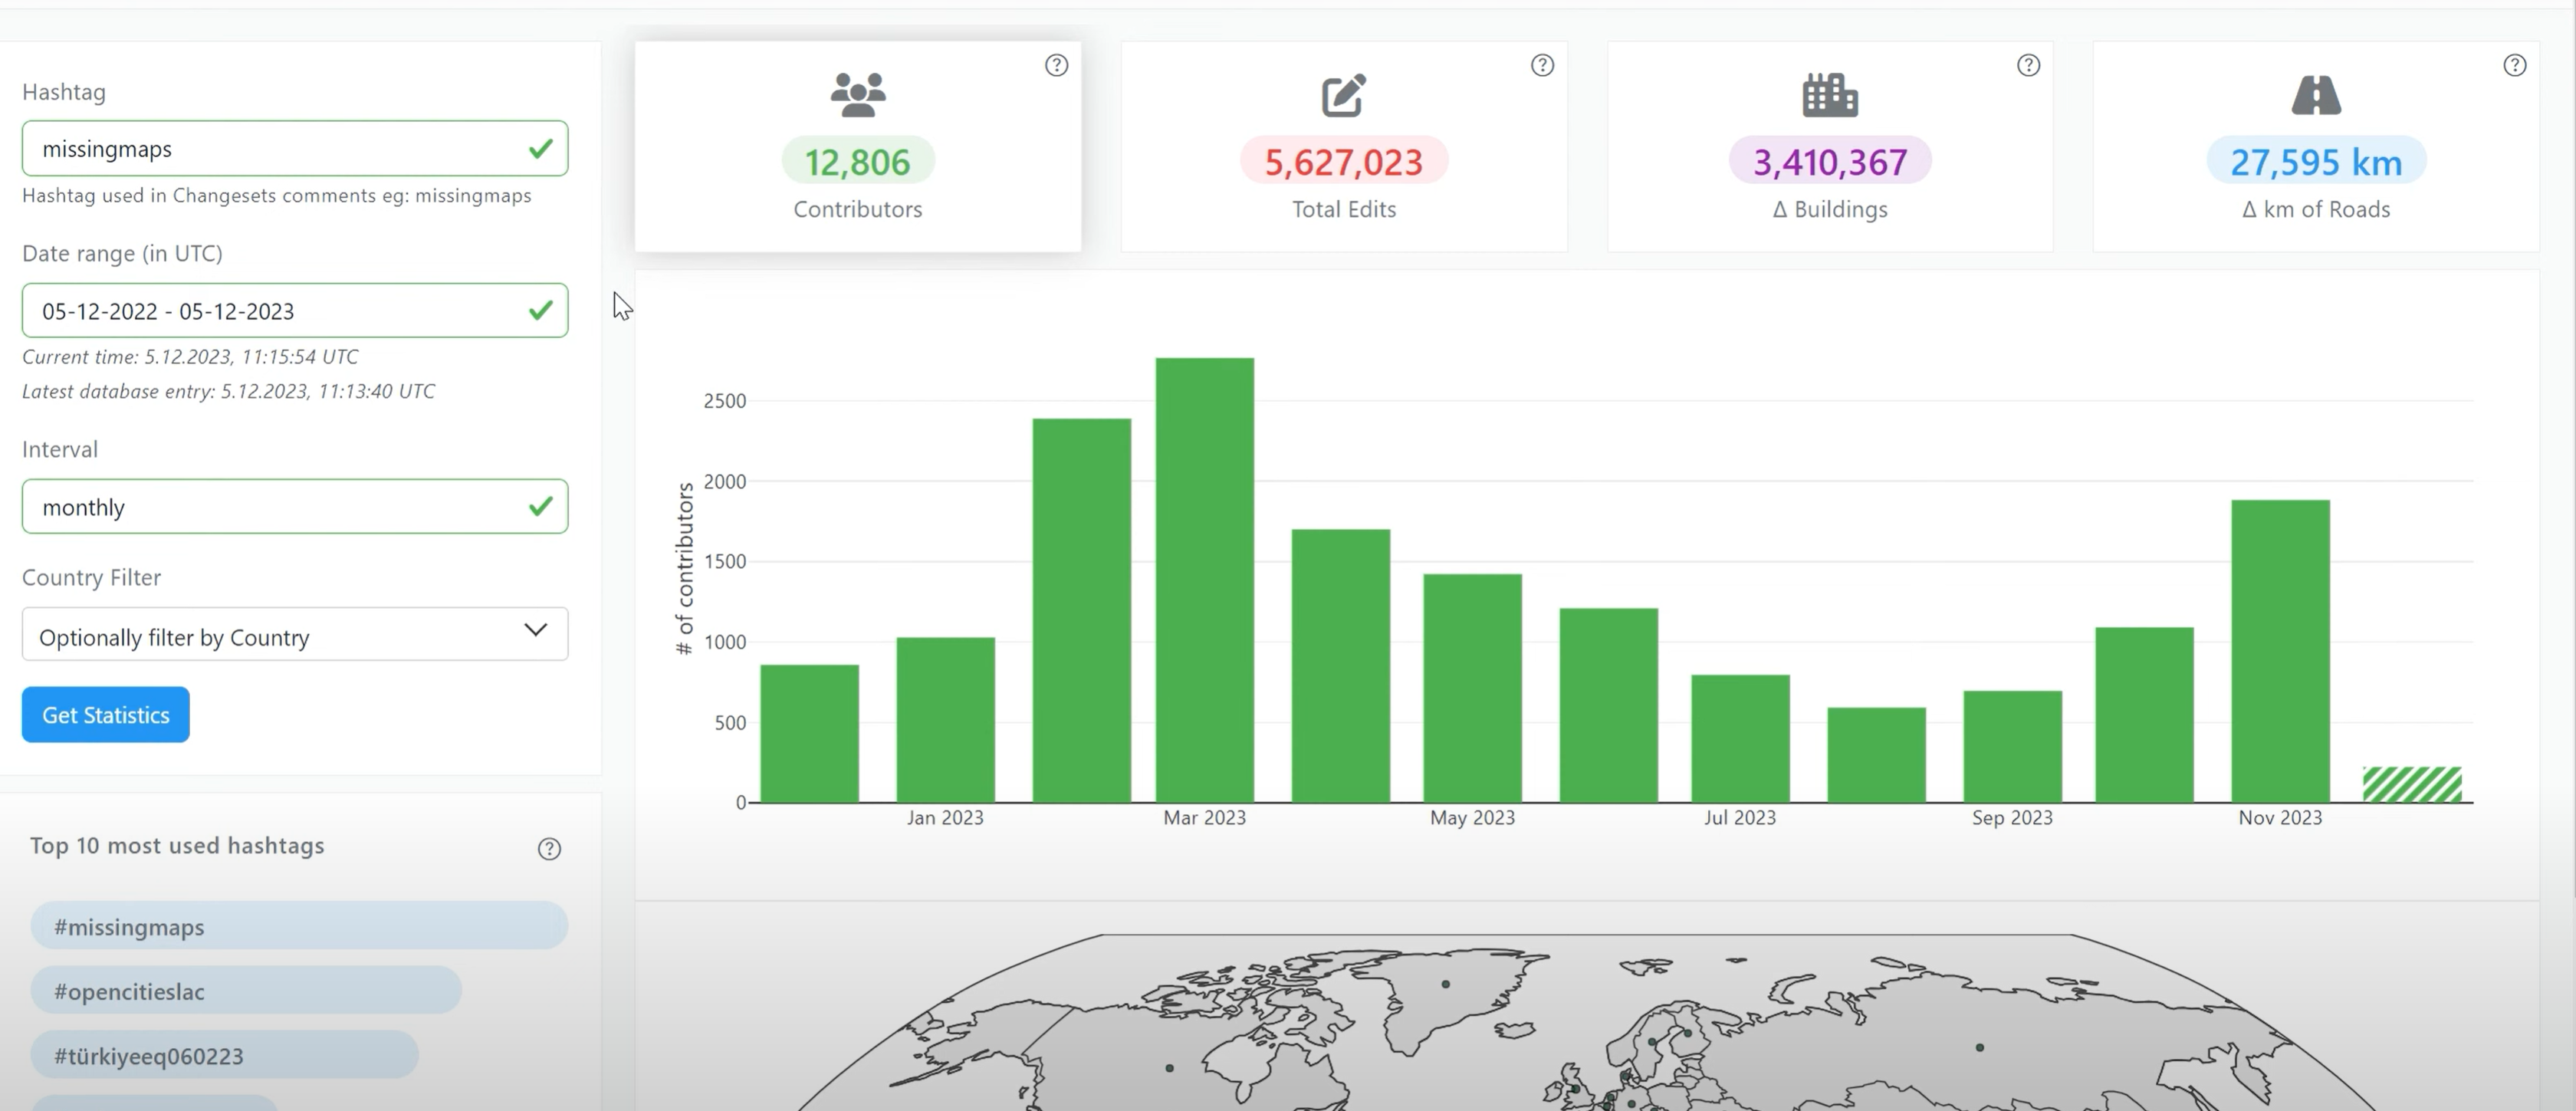
Introducing OhsomeNowStats
OhsomeNowStats allows users to take a look at the mapping activity in OpenStreetMap. This is especially useful for humanitarian organizations and mapathon organizers, because OhsomeNowStats data is updated every 5-10 minutes. Using this tool, user-engagement can be tracked in near real time and used to motivate participants and volunteers alike! By selecting a time range,…
-
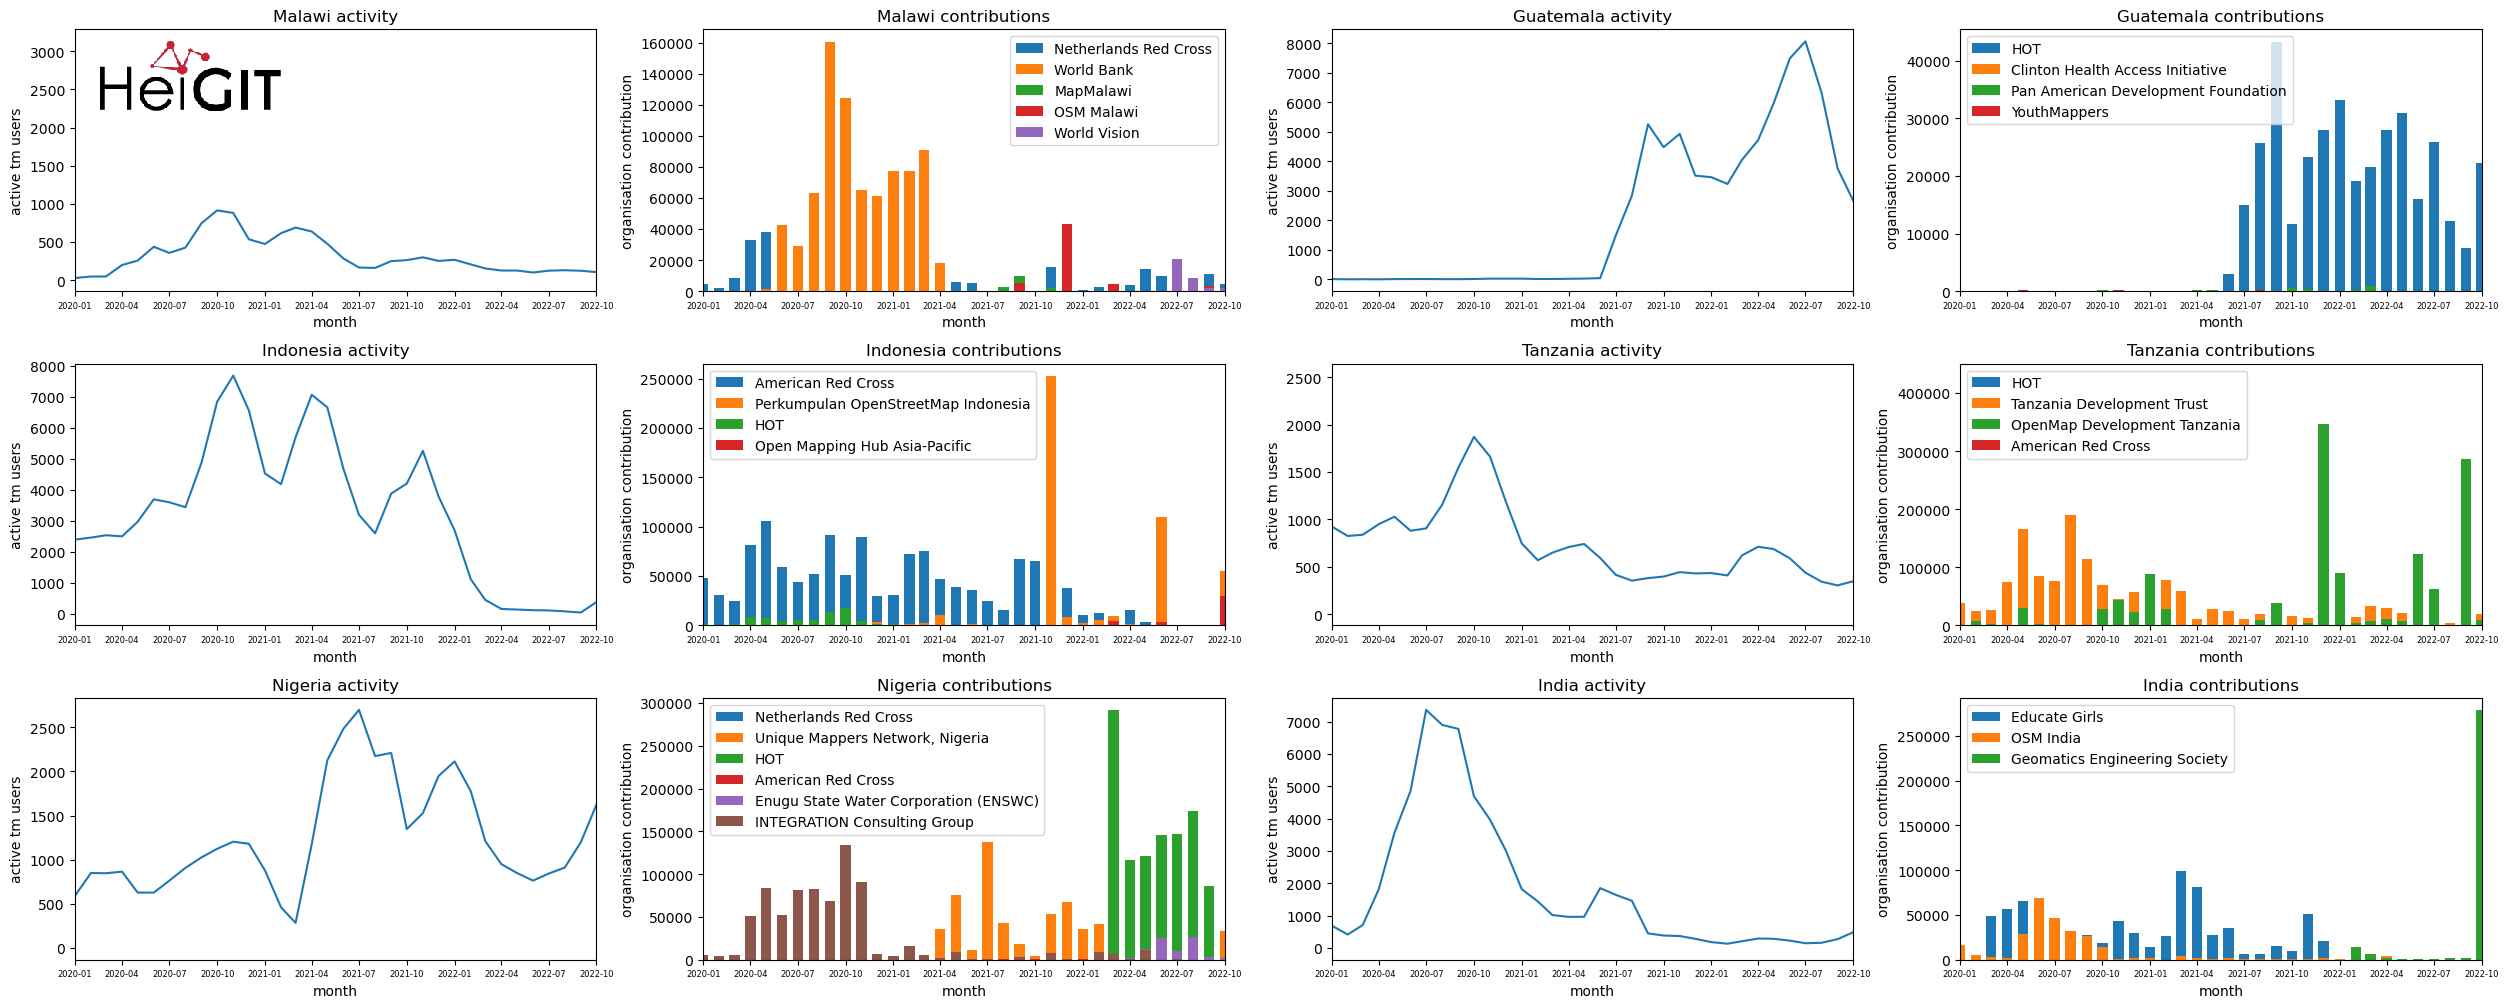
Analysis of Humanitarian OSM Stats: User activity through HOT-TM and contributing organizations
Introduction In this blogpost we are taking a look at humanitarian mapping through the Tasking Manager (HOT-TM) that is operated by the Humanitarian OpenStreetMap Team (HOT). At HeiGIT we work together with HOT to provide analyses and statistics to further understand mapping activity. Explore the user and mapping stats of all Tasking Manager activites here. Check our blog posts about topics…