


HeiGIT and the Amsterdam University Medical Centers (UMC) partnered up to investigate food environments through the lens of OpenStreetMap (OSM) data. UMC analyses how exposure to different categories of food related retailers affects health matters. The assumption is that the distance to retailers of a certain category, as well as the number of these retailers, can influence the health of people living in an area. This analysis is part of the European EXPANSE project, a five-year research project which focuses on the urban exposome, which encompasses all environmental drivers of health and diseases. 20 academic and non-academic partners located in 14 European Countries and the USA are involved in the EXPANSE Project.
In order to be able to do such an analysis reliable and up-to-date information on food retailers is required. OSM holds the potential to be a source of such information, as it usually shows up-to-date data with high completeness in Europe. However, those assumptions need to be tested for the area of interest of the food environment analysis. This was the task of the HeiGIT team.
OSM Quality Analysis Results
We calculated the completeness and currentness for eight different categories of food or beverage retailers mapped in OSM across 17 areas of interest (AoIs) in Europe. Each AoI consists of multiple NUTS-3 polygons for which the two OSM quality indicators are calculated for each category of food or beverage retailer, resulting in 16 indicators per polygon. These indicator results are combined into a single report that represents the average quality indication across all retailer categories. However, if one of the indicators shows low completeness or low currentness, the overall result will also be marked as “low quality”. Following this approach, OSM cannot serve as a data source for the analysis in the respective area if a single quality aspect of data is unreliable.
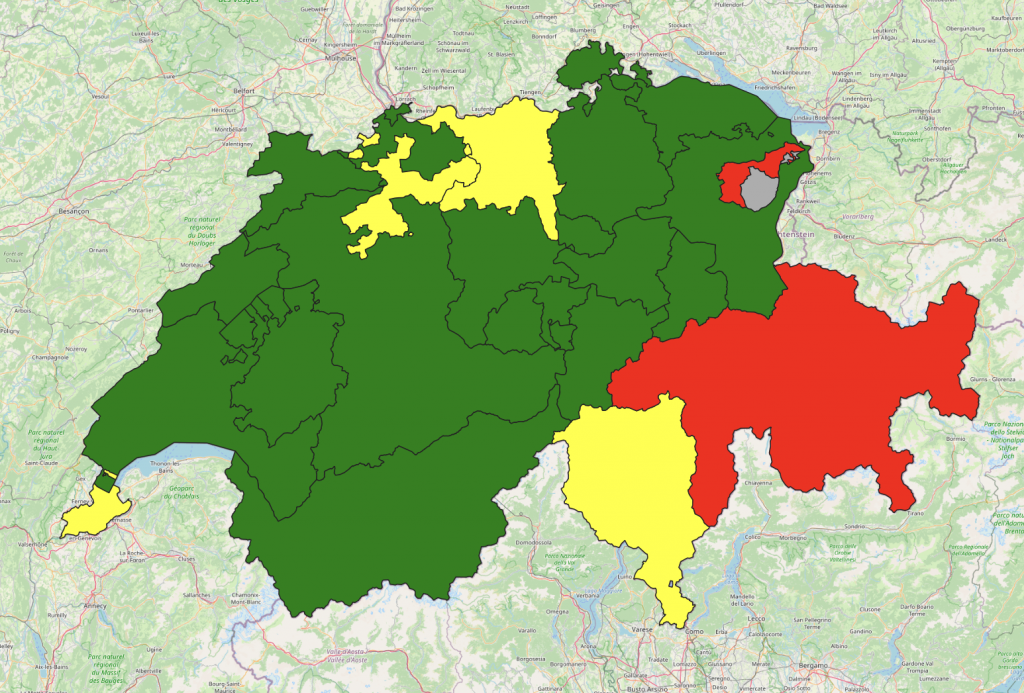
The overall result and the completeness indicator results were added as attributes to each polygon per AoI. These generated GeoJSON files were made available to the project partners, allowing them to use GIS to visualize the results and assess which parts of their AoIs OSM is a suitable data source. It is also possible to visualize the completeness for each retailer category. Visualizing the results on maps provides a quick overview of the quality of the OSM data and allows comparisons to be made between different regions. A guide on how to visualise the results of our ohsome quality API in QGIS has been published in this blogpost: Visualizing OQT API Results in QGIS.
For in-depth analysis of a region, a quality report per polygon was generated and submitted. These reports show the overall quality assessment as well as the 16 indicator results. The indicator results are accompanied by a description and graphs that further explain the respective score. Below are the data quality indicator figures for the category ‘Restaurants’ from the quality report of one of the regions in Switzerland.
Figure 2 shows the number of local food shops mapped in OSM and a fitted curve to this data. If the growth of the fitted curve is minimal, it can be assumed that no new features can be added to OSM as all features are already mapped. Mapping is therefore saturated and OSM is almost complete in regard of the respective features.


Figure 3 shows the date of the last edit of the respective features within the area of interest or when they were created. Rather than assuming the completeness of features, this indicator refers to data quality in respect to currentness. It tells us whether features were once created but not kept up-to-date or if the data is being maintained.
These results form the basis on which project partners can decide if and for which areas OSM can be used as a data source for their project. Although we can assess the quality of the OSM data, it is important to determine which levels of completeness and currentness are “good enough” for the OSM data to be used in the analysis. Oftentimes, this can be complicated as each project requires a different level of quality depending on the research and its scale.
Background Information
To find out more about the quality assessment of OSM data, visit ohsome quality analyst (OQT). If you want to try out the completeness and currentness indicators yourself, check out the ohsome – dashboard. See also this blog post about the integration of the ohsome quality API (formerly ohsome quality analyst) into the ohsome dashboard: Version 1.0 der ohsome quality API und des ohsome Dashboards [German]
Do you have any questions or would you like to find out more about our tools? Then feel free to contact us at ohsome@heigit.org.