

Tag: OSM
-
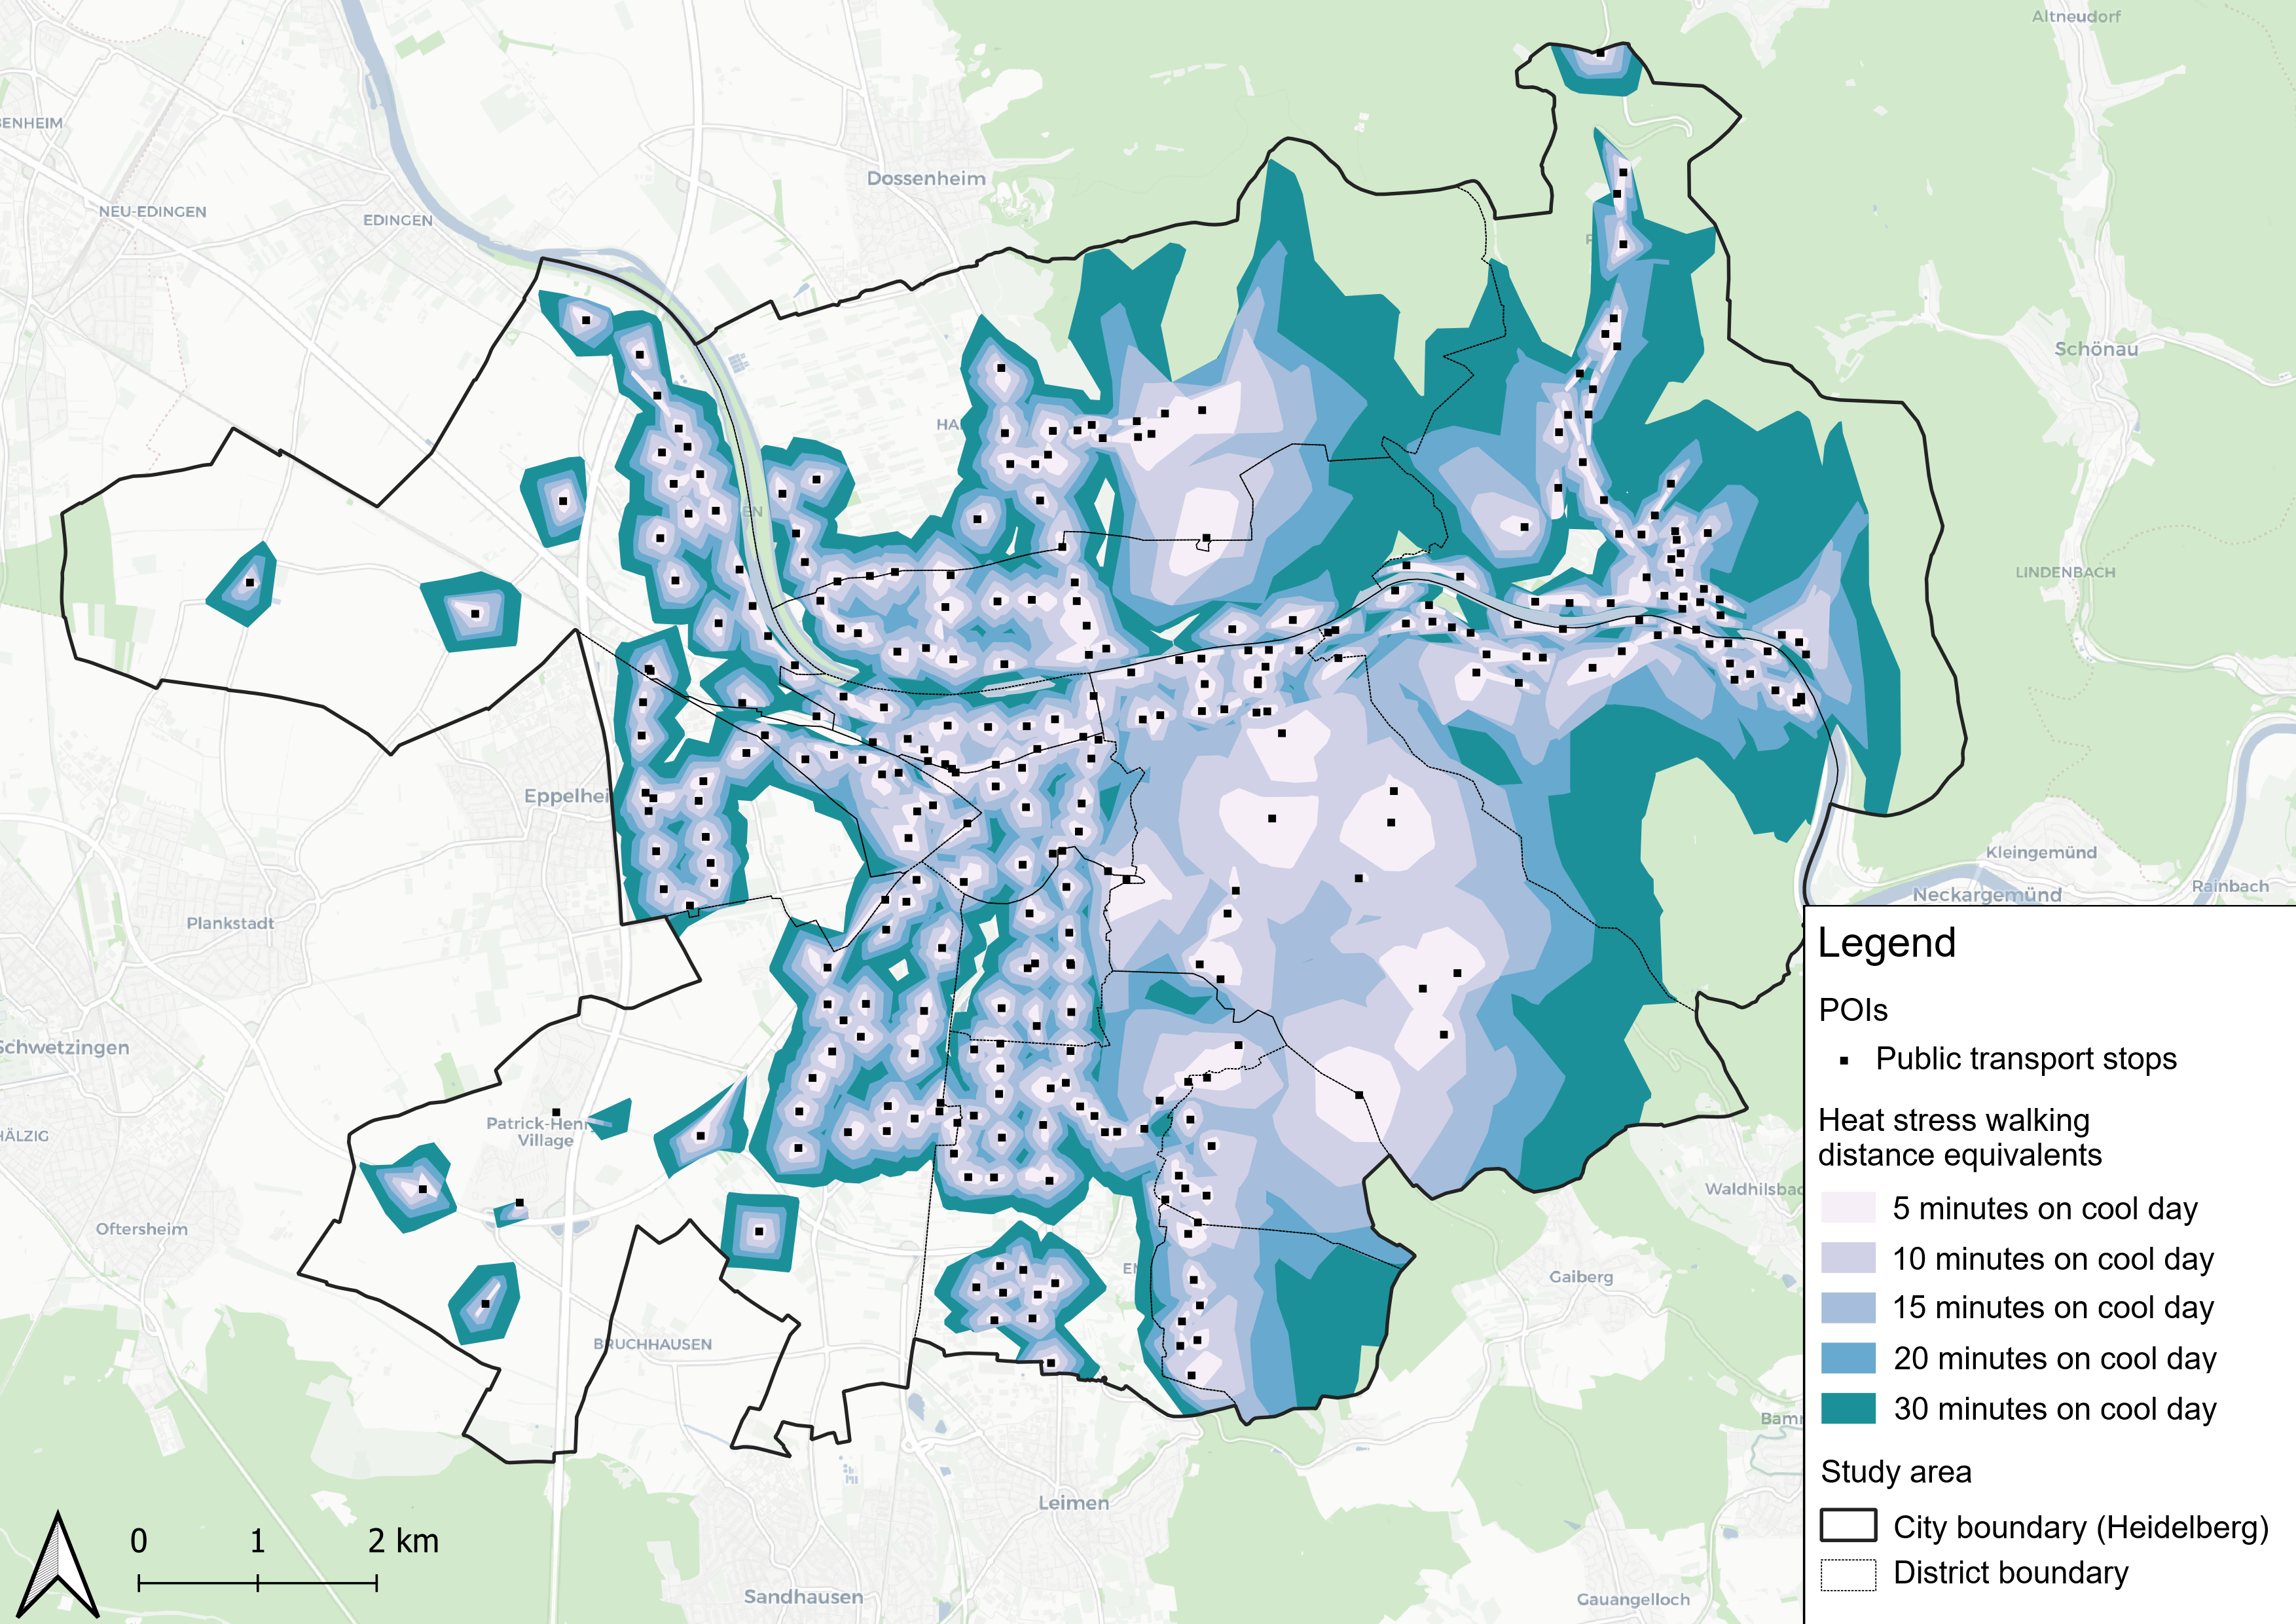
New Paper “Accessibility for pedestrians under heat stress – the example of Heidelberg, Germany”
This study introduces the isocalor approach to assess how solar exposure and heat stress impact pedestrian access to essential services in Heidelberg, using OpenStreetMap data and a customized openrouteservice routing engine. As climate change intensifies, cities are increasingly exposed to extreme heat events, with urban populations—especially vulnerable groups like older adults, children, and those with…
-
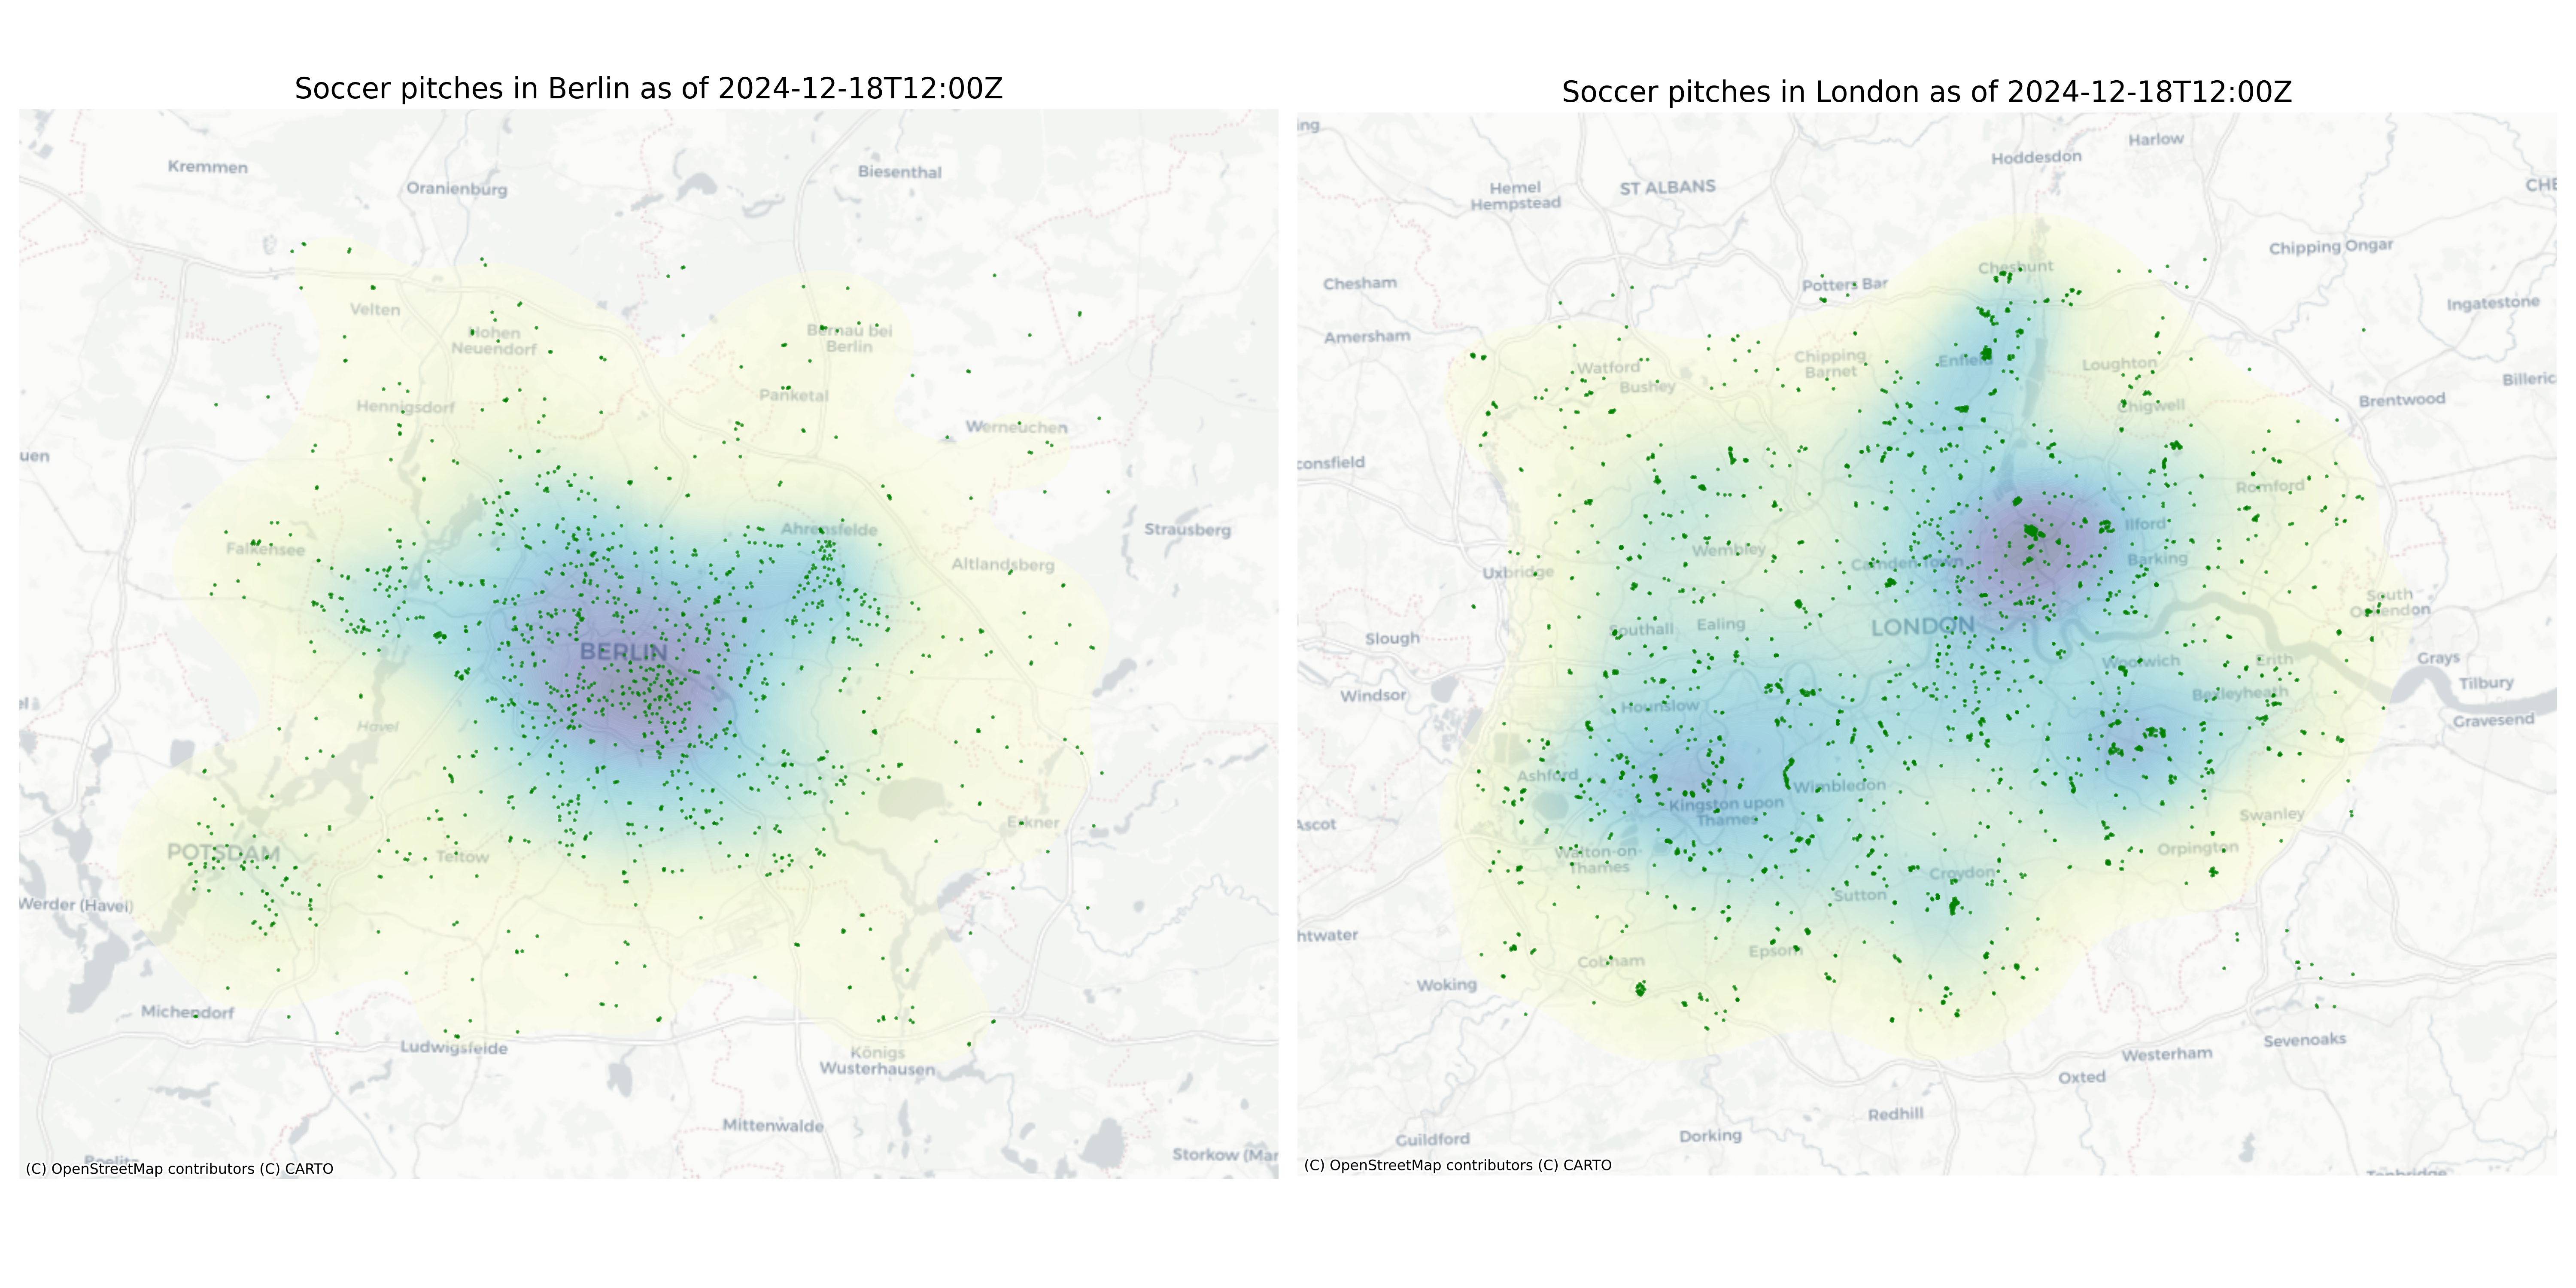
ohsome-py 4.0.0
The ohsome-py Python package is a client for the ohsome API, designed to facilitate the extraction and analysis of historical OpenStreetMap (OSM) data. The package simplifies handling API requests and responses by converting them into pandas or GeoPandas data frames, making data analysis and visualization easier. With ohsome-py, you gain all the functionalities of the…
-
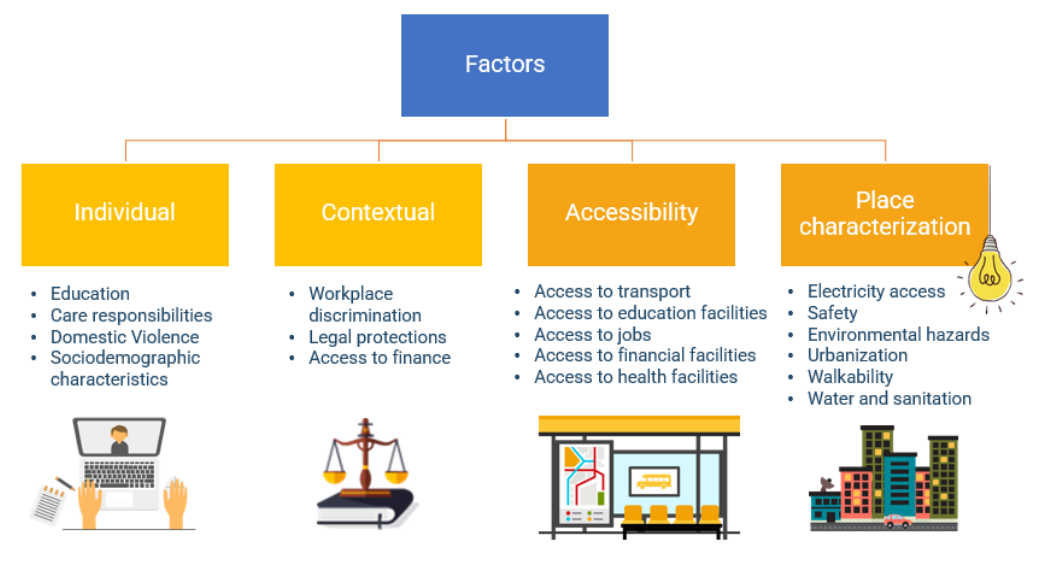
Quality Assessment for World Bank GEEST Methodology
A workgroup of the World Bank is researching and evaluating the key spatial factors affecting women’s employment opportunities in the renewable energy sector. Their research aimed to develop an analytical tool, the Gender Enabling Environments Spatial Tool (GEEST), designed to assess localities based on how supportive they are in enabling women to access employment or…
-
New Paper: “Enriching building function classification using Large Language Model embeddings of OpenStreetMap Tags”
Rapid global urbanization is placing immense pressure on planners to make informed decisions that promote sustainable growth. A crucial aspect of this challenge is understanding how urban buildings are used. Traditionally, classifying the function of buildings—such as residential or commercial—relies on costly and subjective on-site surveys. However, advances in AI are poised to transform this…
-
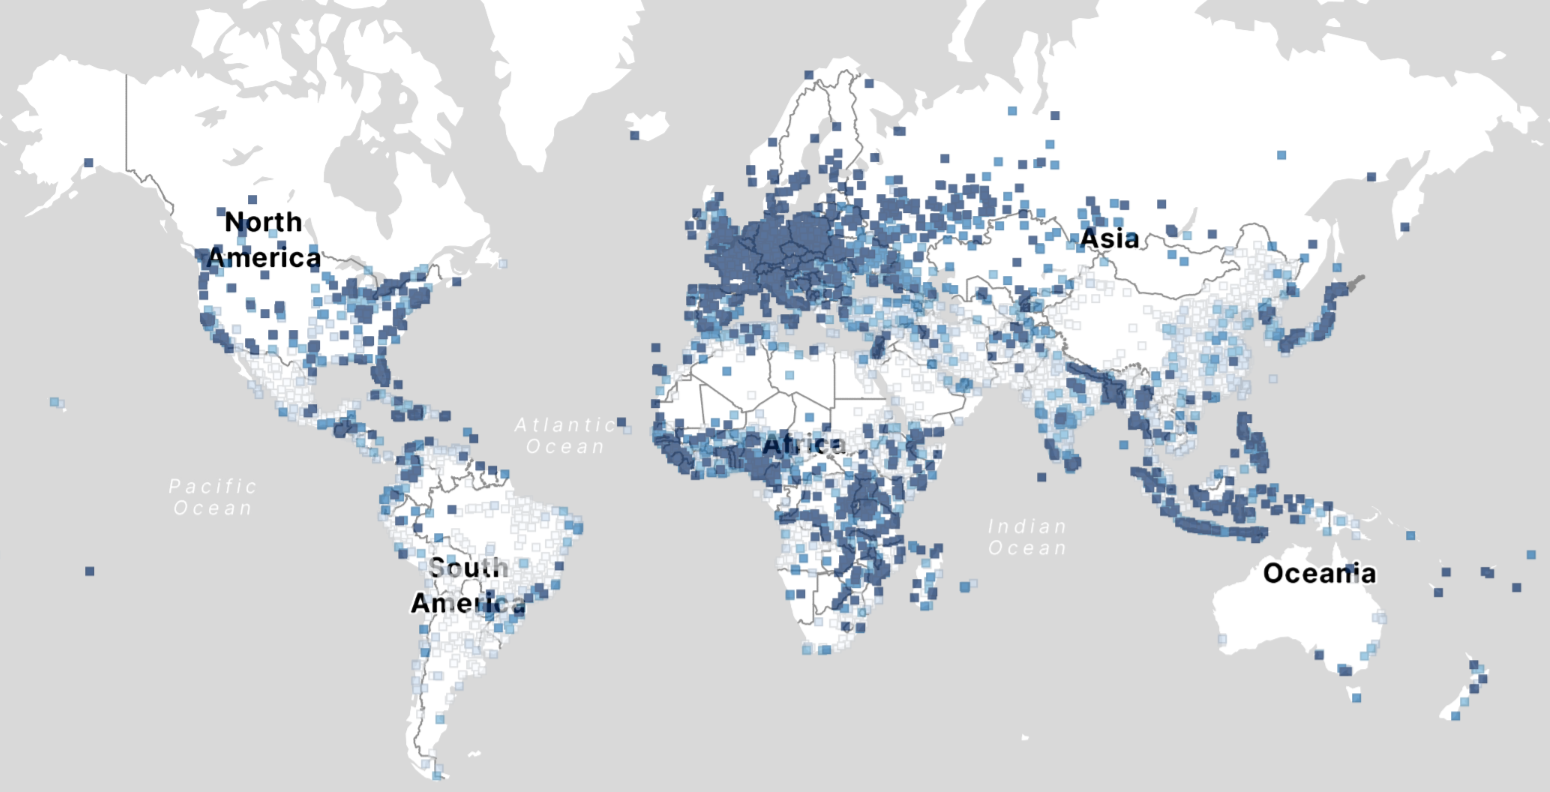
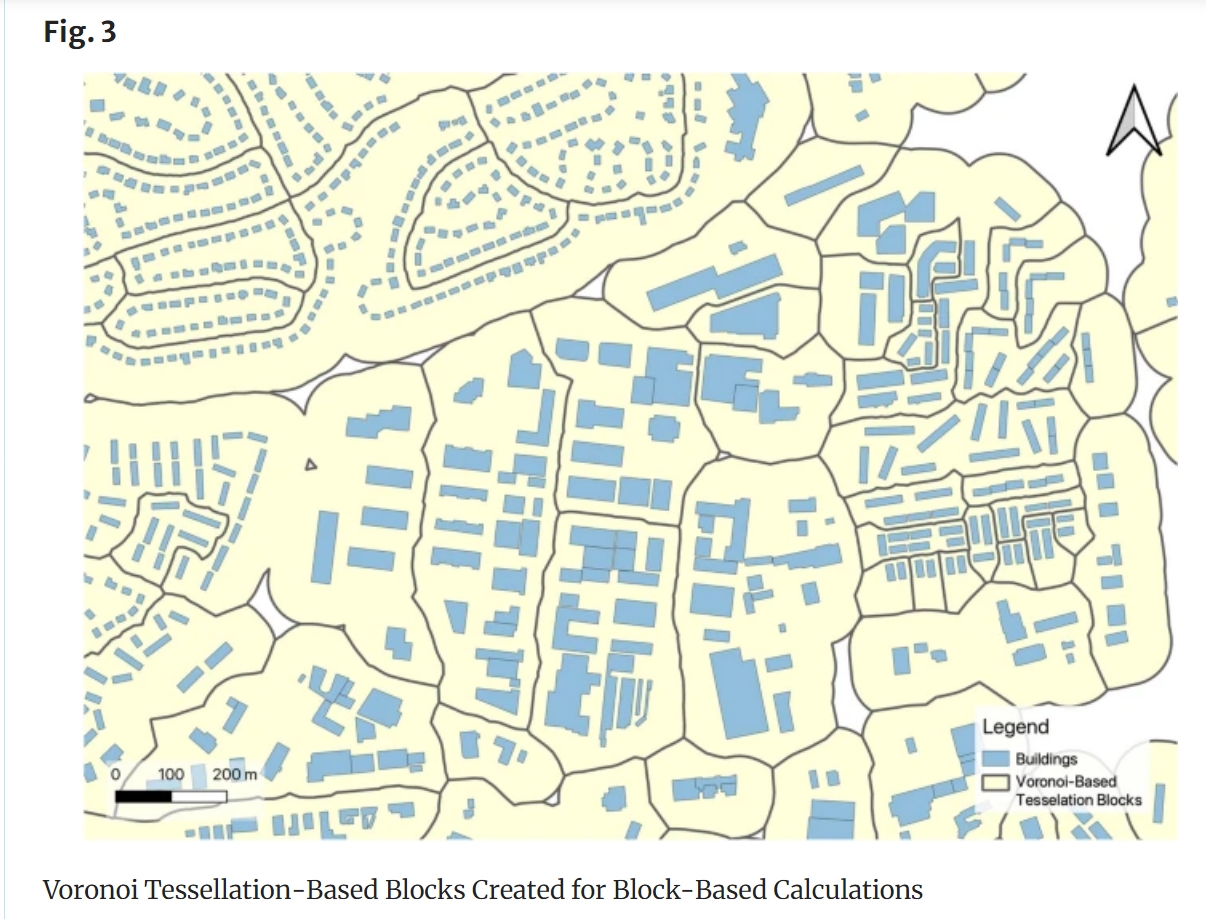
Analysis of OSM building data completeness using new data
With thousands of people mapping in OSM every day, missing building data in urban centers is steadily decreasing. Since OSM is a widely used source for projects researching urban phenomena around the world, a good data quality and an even distribution are important factors. If a spatial bias is present but not accounted for, researchers…
-
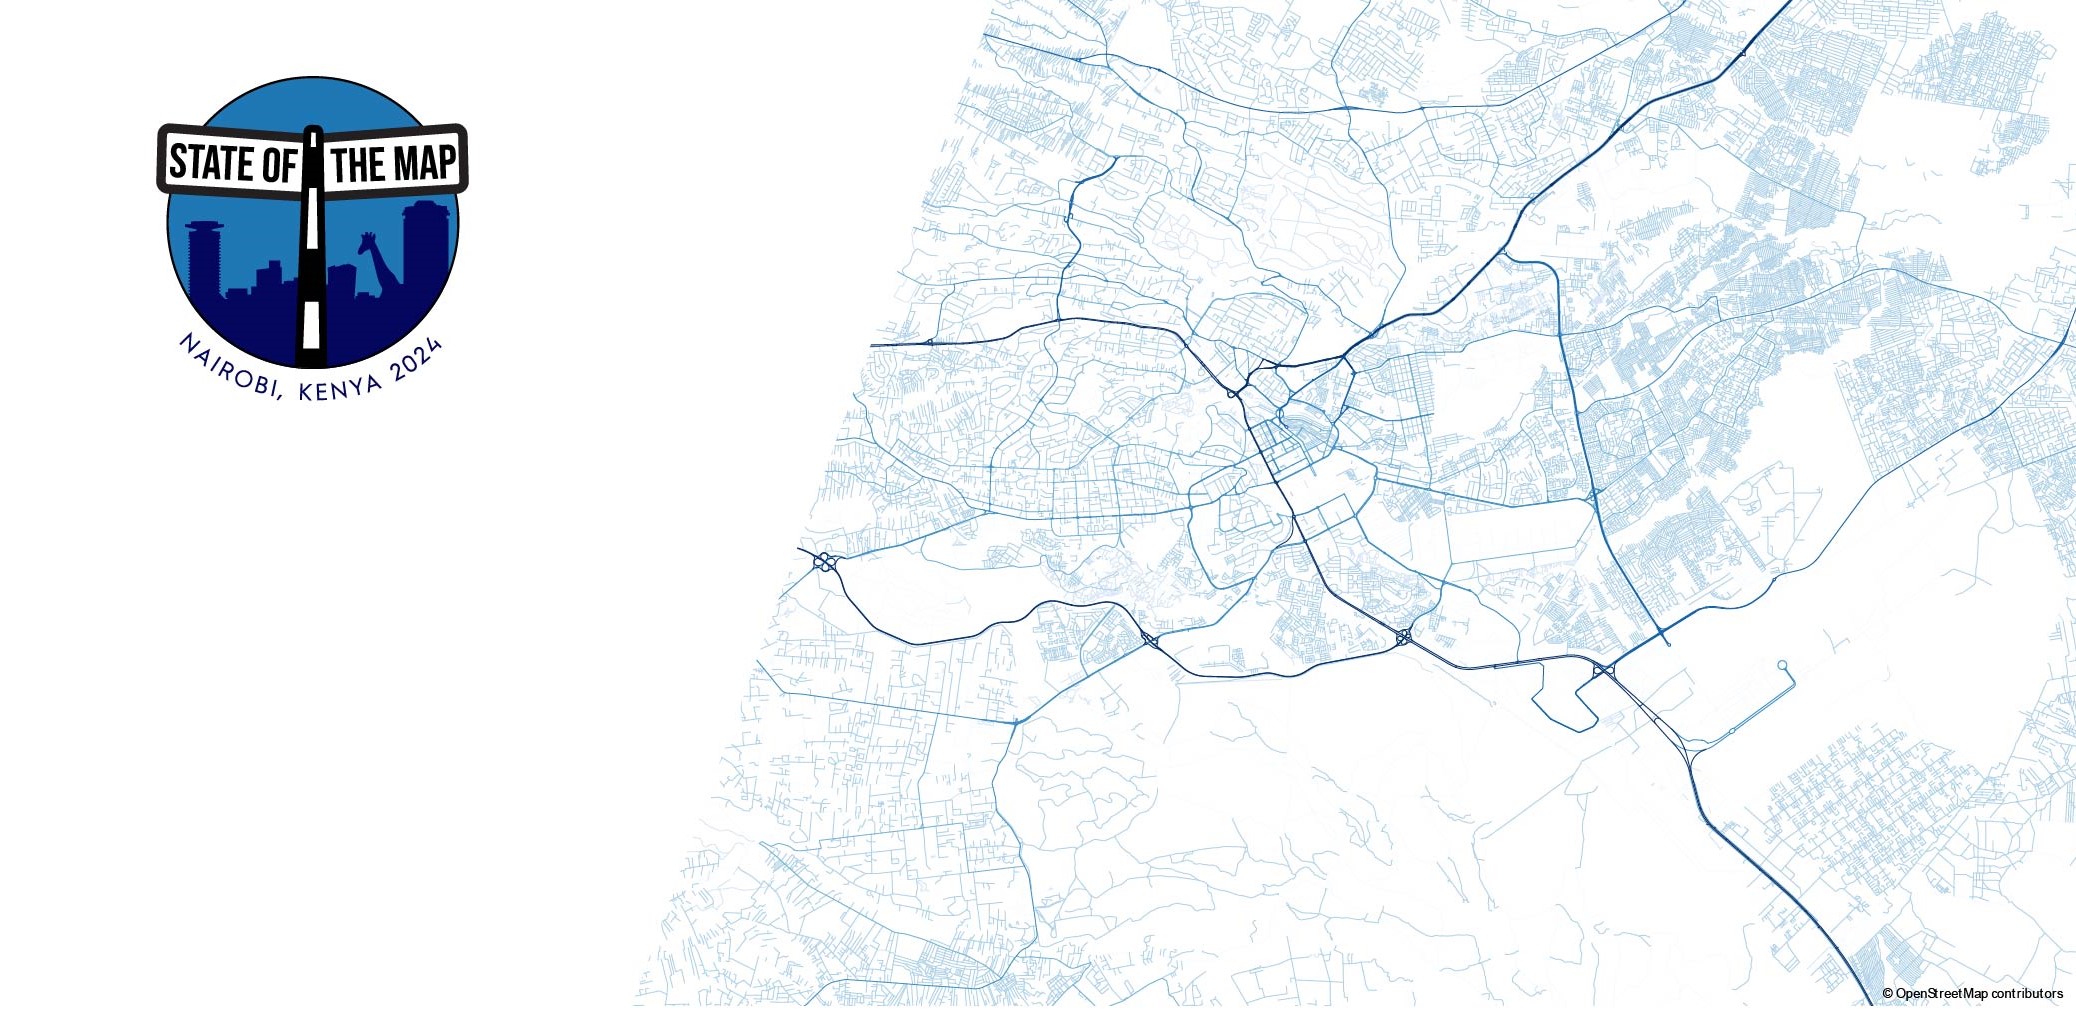
HeiGIT at State of the Map in Nairobi, Kenya
State of the Map is the annual event for all mappers and OpenStreetMap users. In 2024 the State of the Map conference will be taking place from September 6 to 8 in Nairobi, Kenya as well as online. The conference programme contains talks, workshops, discussion rounds and more. Four talks as well as a workshop…
-
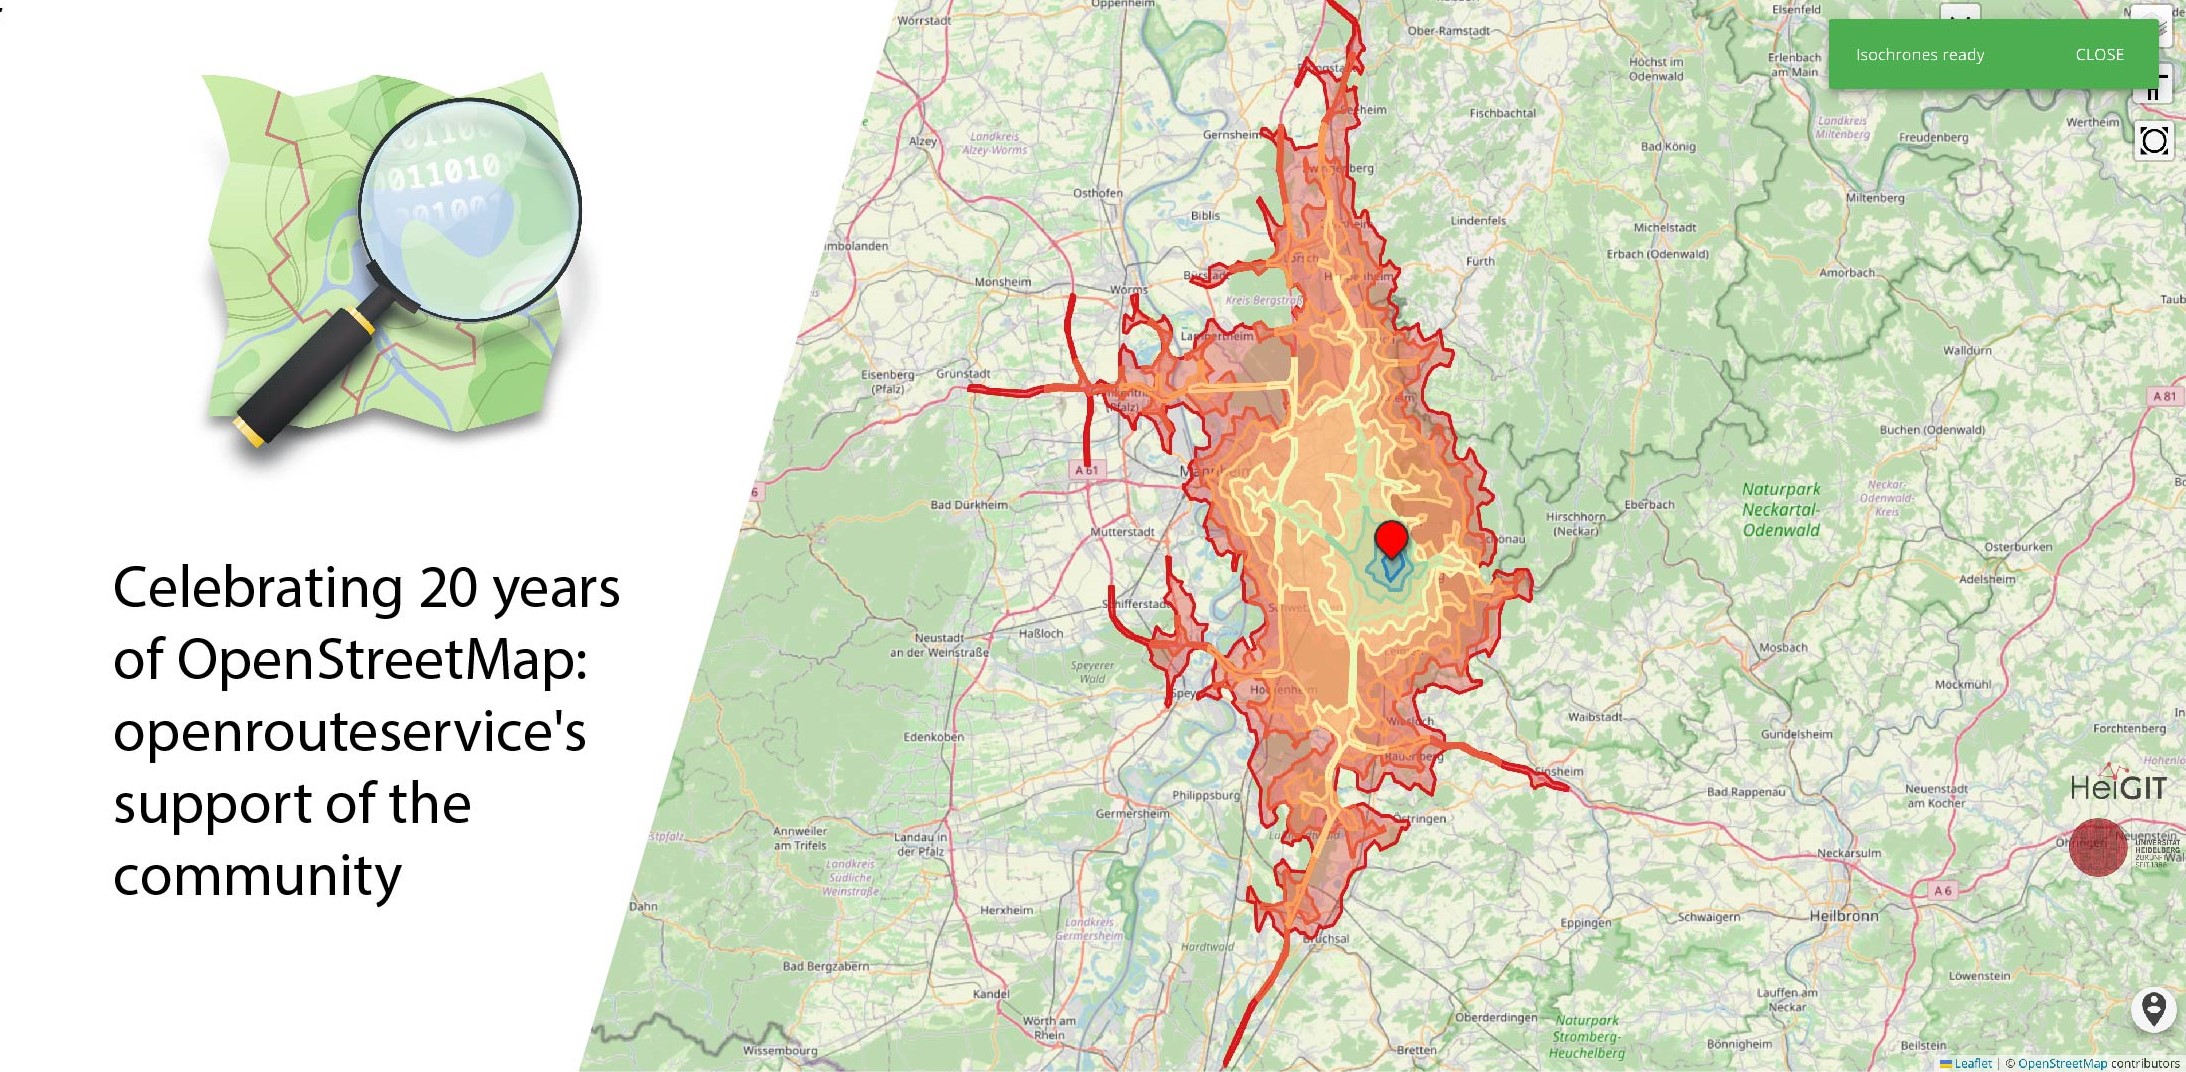
Celebrating 20 Years of OpenStreetMap: Openrouteservice’s Support of the Community
August 9 marks a turning point for the global mapping community: the 20th anniversary of OpenStreetMap (OSM). For two decades, OSM has revolutionized the way we perceive and interact with maps, transforming them from static representations to dynamic, community-driven resources. OpenStreetMap began as a visionary project aimed at creating a free, editable map of the…
-
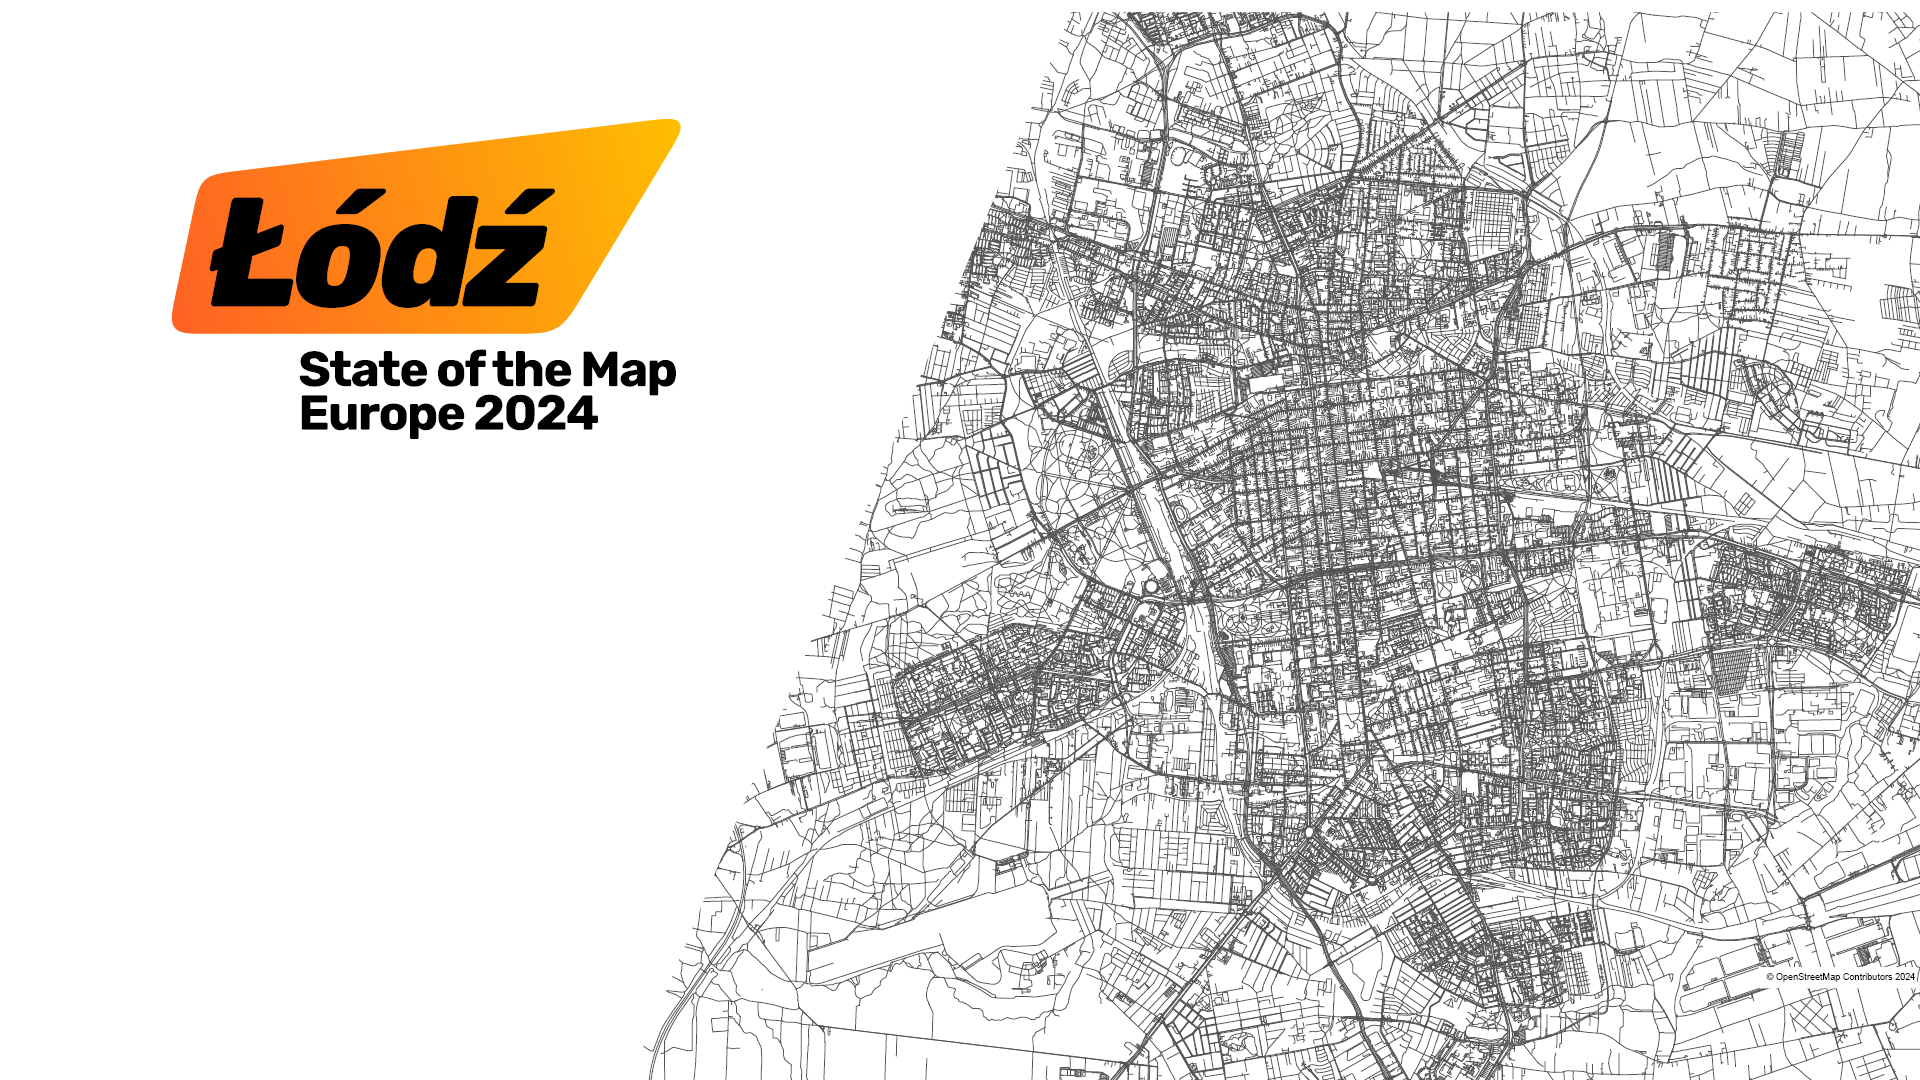
Our Contribution to the State of the Map Europe 2024 Conference in Łódź
This year, two of our colleagues will participate at the State of the Map Europe 2024 Conference, which will take place from July 18-21, 2024, in Łódź, Poland. The annual event is a cornerstone for the European (OpenStreetMap) OSM community, attracting developers, scientists, designers, social activists, companies and enthusiasts worldwide to enhance mapping practices and…
-
The new MapSwipe Web App is here!
No matter where you are or which device you are using, you can now do voluntary work and make a difference, all from your browser with MapSwipe Web App! Since 2015, MapSwipe has harnessed the collective force of volunteers to actively contribute to geoinformation-related projects. In science and in fields such as city and traffic…
-
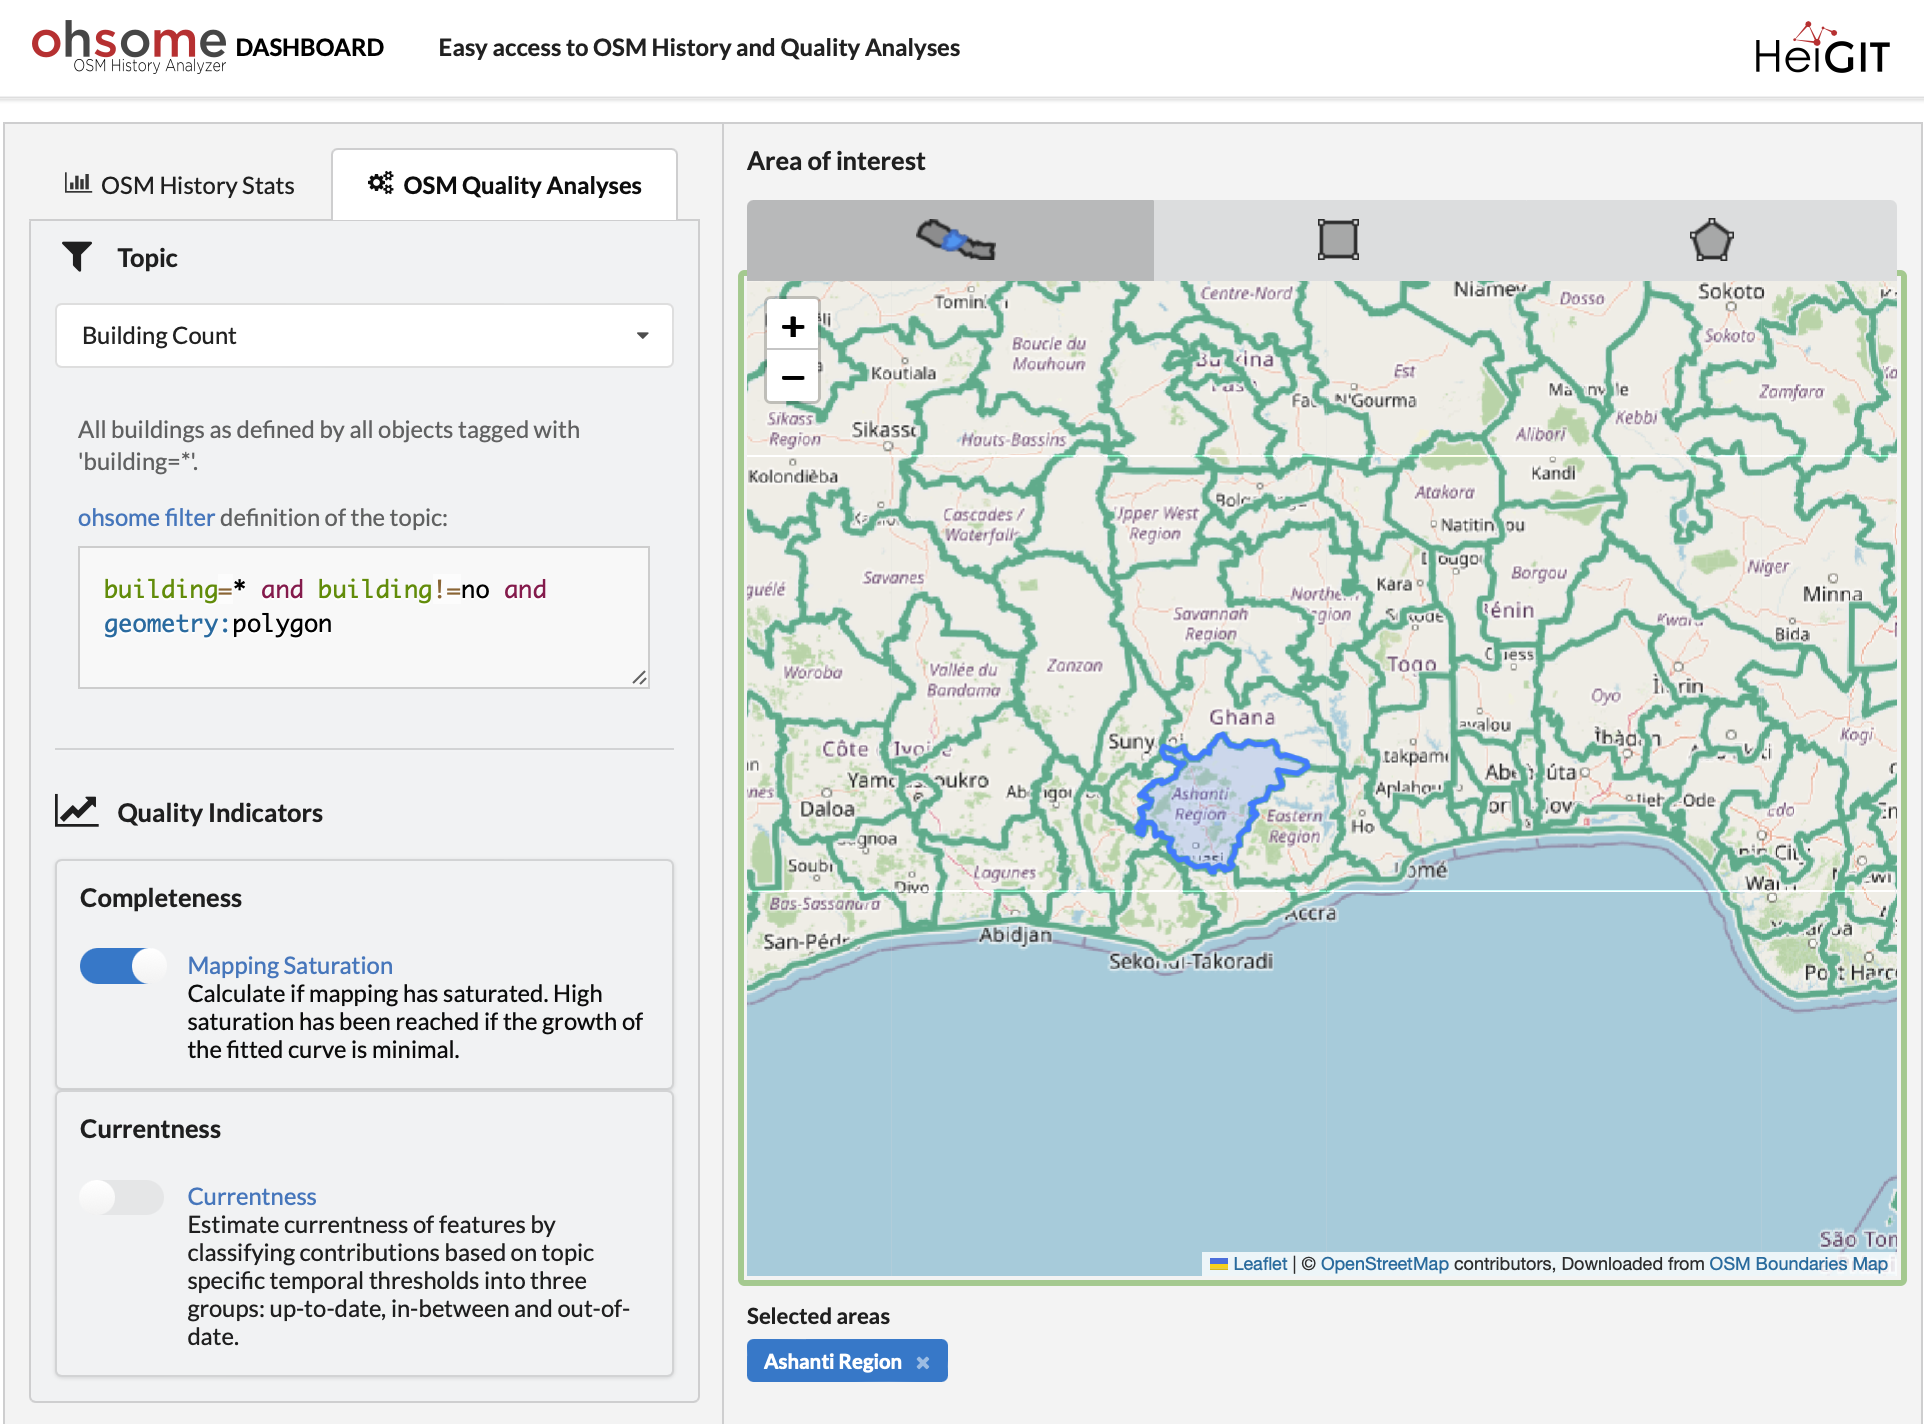
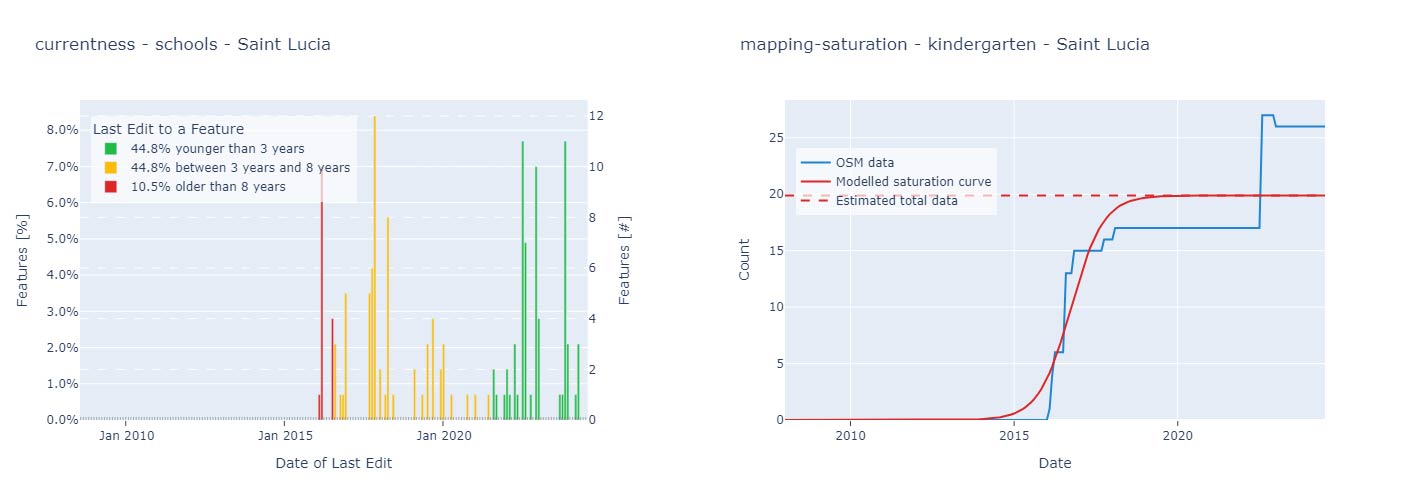
ohsome Quality API: New Features
Are you ready to take your OpenStreetMap (OSM) data analysis to the next level? We’re excited to showcase the latest features of our ohsome Dashboard, designed to provide you with insights into OSM data quality. With the ohsome Dashboard, analyzing OSM data has never been easier. Whether you’re interested in evaluating mapping saturation, currentness, or…
-
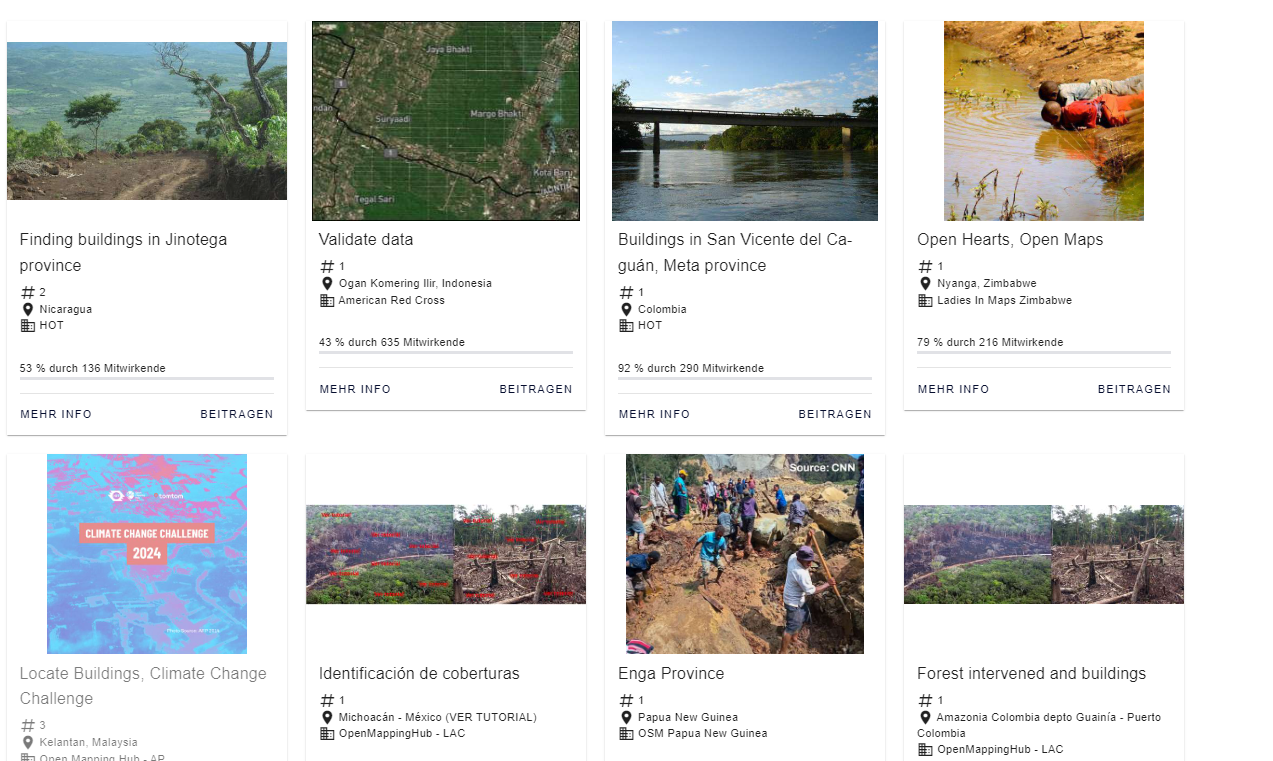
GeoNight Mapathon on April 12th
Our next Mapathon is just around the corner, and this time, we’re joining forces with OpenStreetMap Ghana to improve coverage and to help disaster risk assessment.Join us and be a part of the GeoNight 2024 to celebrate geography together in all its forms and facets! Everyone is welcome and no previous knowledge is needed!Do bring your laptop and preferably…
-
Empowering Change: OpenRouteService in Geospatial Initiatives for Women’s Economic Empowerment and Sustainable Development
The use of open-source geospatial data, exemplified by services like openrouteservice (ORS), proves to be beneficial for both academic research and use case studies. Witnessing our technologies applied in unanticipated ways showcases their potential to meet the evolving needs of various sectors while contributing positively to both society and the environment. One exemplary application is…