

Are you ready to take your OpenStreetMap (OSM) data analysis to the next level? We’re excited to showcase the latest features of our ohsome Dashboard, designed to provide you with insights into OSM data quality.
With the ohsome Dashboard, analyzing OSM data has never been easier. Whether you’re interested in evaluating mapping saturation, currentness, or comparing OSM data with external datasets, our platform has you covered. Let’s dive into some of the exciting new features we’ve recently introduced.
Watch the added features in the newest video about the ohsome dashboard on our YouTube channel or dive into the blogpost below for detailed information and explanations about the dashboard and its features.
Comparative Analysis for Enhanced Data Quality Assessment
One of the standout features of the updated OSM Quality Analyst is the ability to compare OSM data with external datasets. This functionality offers a valuable indication of OSM data completeness by assessing the quantity of data recorded in a specified region. By comparing OSM data to other datasets, users can gauge whether OSM adequately covers the area or if there are areas of potential improvement. Namely, we have implemented a completeness comparison into the dashboard, which displays statistical data about the overlap of OSM and Mircrosoft data for roadsand and one for buildings which displays the overlap of OSM, Microsoft building footprints and EUBUCCO data.

Fig. 1: Building Area Comparison
Workflow
To calculate the length of the Microsoft Roads covered by OSM, a buffer is first created around the Microsoft Roads and then intersected with all OSM Roads. This method extracts the OSM roads that are in the vicinity of Microsoft Roads. The OSM roads are then buffered again, to be able to correctly count e.g. two-lane highways that have been separately entered in OSM. The aim of this workflow is to make the subsequent intersection with the Microsoft Roads more efficient. This analysis results in the length of all Microsoft Roads that are covered by OSM.
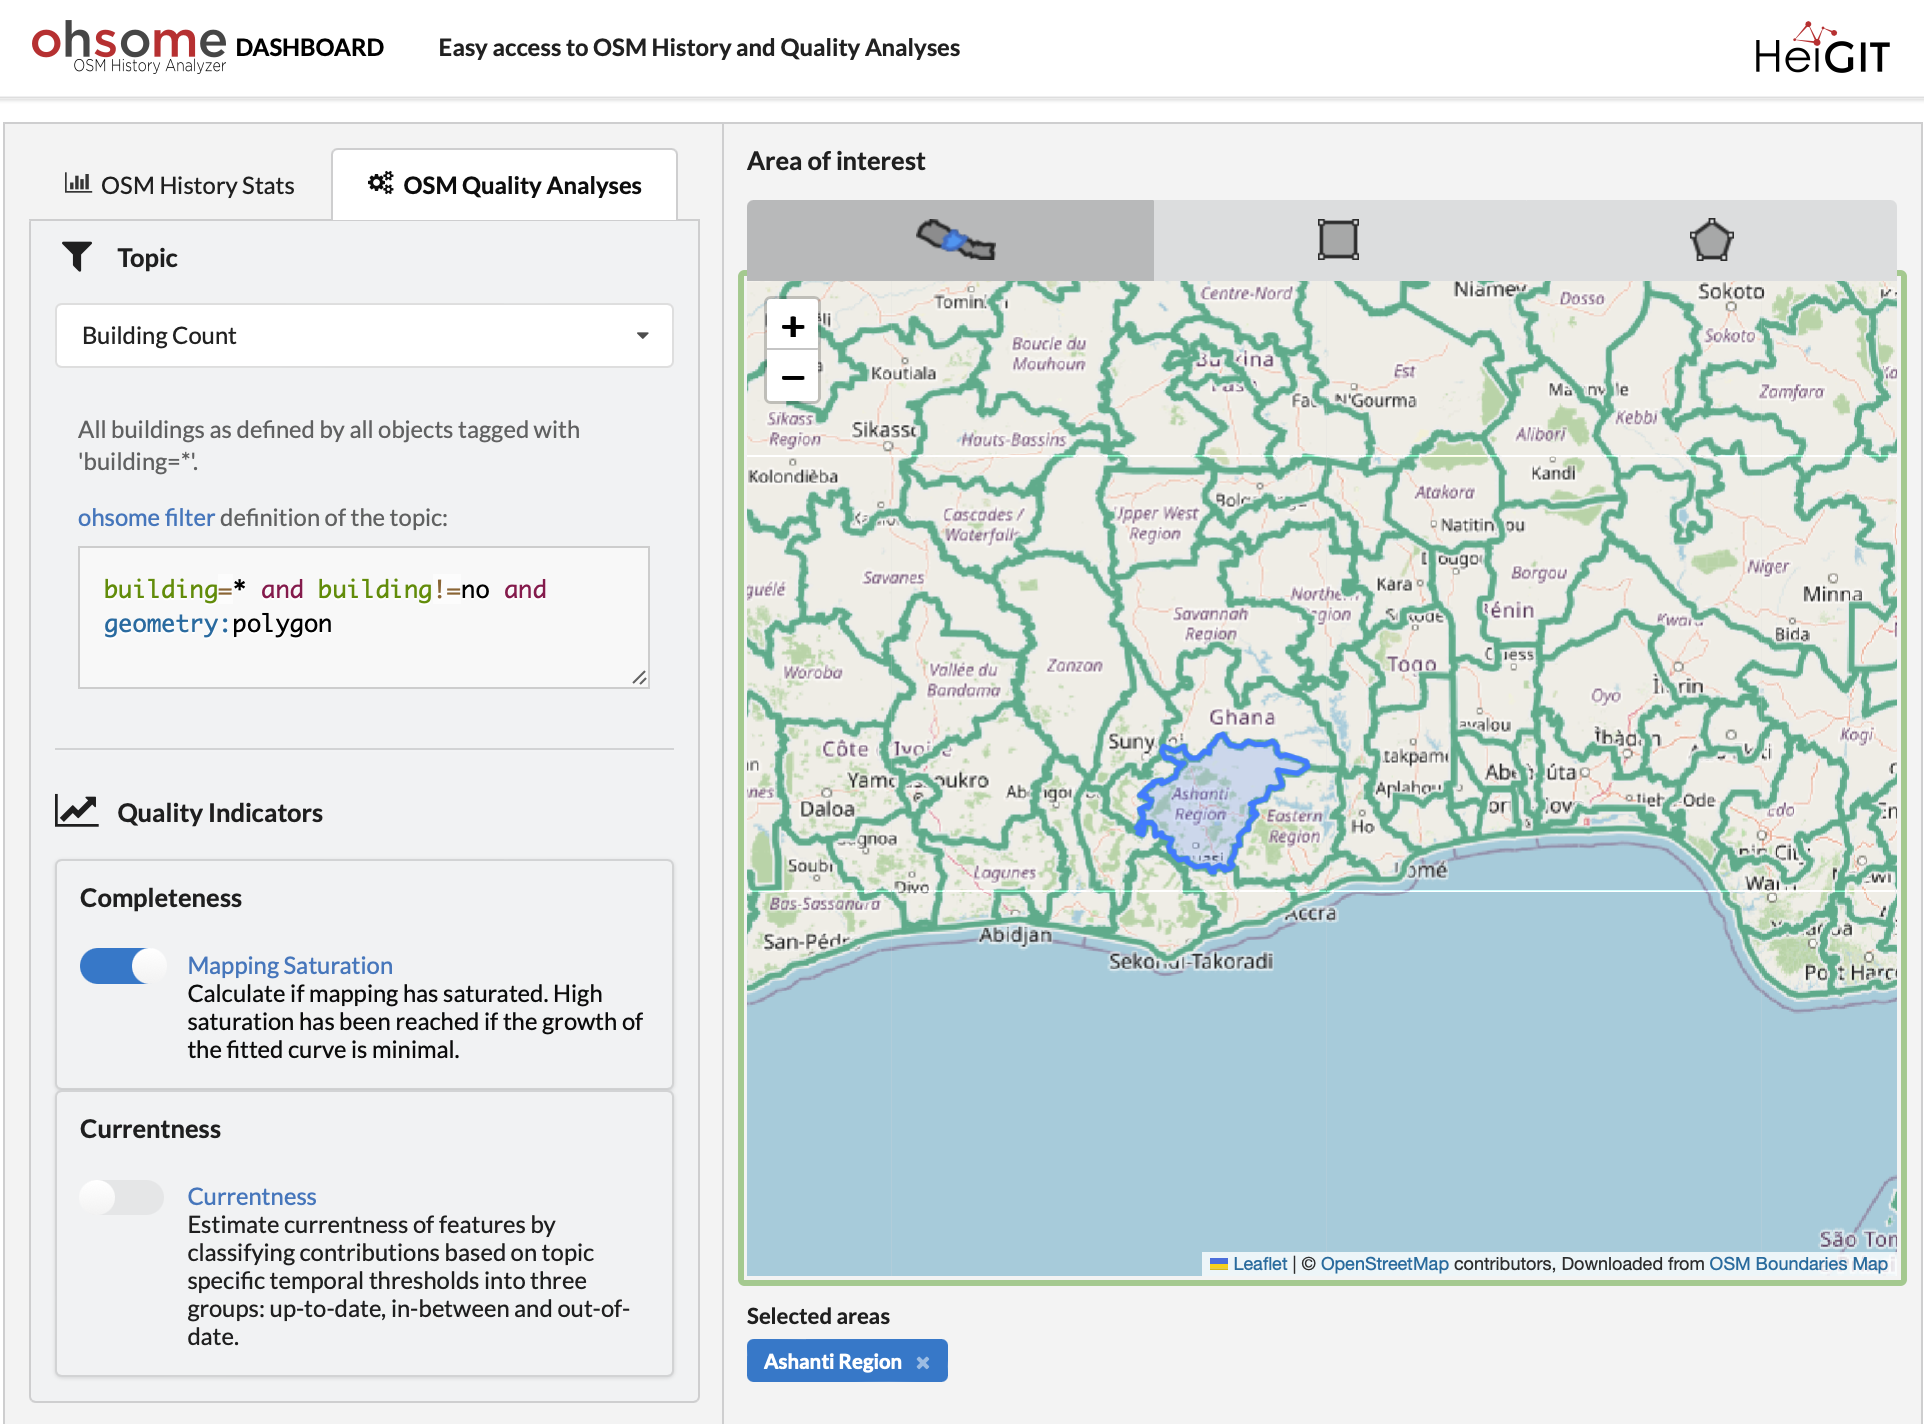
Easy-to-Use Interface for Seamless Analysis
Navigating the ohsome Dashboard is intuitive and user-friendly. Simply select the OSM Quality Analyses tab, choose a topic of interest, and the dashboard will automatically generate the appropriate OSM filter for your query. From there, you can refine your analysis by selecting specific indicators, such as mapping saturation or currentness, to tailor the results to your needs.
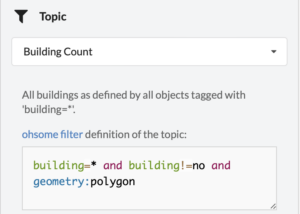
Fig. 2: Topic and ohsome filter definition.
Flexible Region Selection for Customized Insights
Whether you’re interested in analyzing data at the administrative level or within a custom area of interest, the ohsome Dashboard offers flexible region selection options. Users can choose from predefined administrative boundaries or delineate their own area of interest using the “Draw Boxes” or “Draw Polygons” tools. This flexibility allows for granular analysis at various spatial scales.
Comprehensive Results Display for Actionable Insights
Upon running your query, the dashboard generates comprehensive results displayed in the Results Log. For comparative intrinsic analyses, a colored tag indicates the degree of completeness of the OSM data in your selected area. This visual cue makes it easy to interpret the results and identify areas where OSM data may be lacking.
Fig. 3: Intrinsic analysis result of mapping saturation.
Real-Time Sharing and Accessibility
Sharing your queries with others is simple with the ohsome Dashboard. Clicking the “Share” arrow allows others to recalculate your query, enabling them to retrieve current results for the selected area. Additionally, access to results via the ohsome API provides advanced users with programmable access to data analysis capabilities.
Open Source and Collaborative Development
Built on open-source technology developed by HeiGIT, the ohsome Dashboard leverages OSM data contributed by OpenStreetMap contributors. The platform’s source code is openly available on GitHub, fostering collaboration and innovation within the OSM community.
Are you ready to explore the power of the ohsome Dashboard? Visit our website to access the dashboard and start analyzing OSM data like never before. Don’t forget to follow us on social media and subscribe to our channel for the latest updates and insights. Together, let’s unlock the full potential of OpenStreetMap data analysis with the ohsome Dashboard.
For any questions or inquiries feel free to contact ohsome@heigit.org.