At long last, welcome back to a new blog post of the “How to become ohsome“-series. As it’s been quite a while since you got an introduction to how to access the ohsome API, we would like to pick up this topic one more time this month. The former post with different ways to access the ohsome API is to be found here. Some new tools are available to help you analyze OpenStreetMap data. Below is a brief overview of the ohsome-py package, the ohsome R package, the ohsome QGIS plug-in ohsomeTools and ohsome2x. For each of the clients, we provide an example of how to query for monthly counts of school buildings (→ building=school) which are mapped as building outline (→ type:way) within a given boundary (“yourboundary.geojson“).
Access via python with the ohsome-py package:
If you want to analyze data with Python, the ohsome-py package can be your tool of choice and can be easily installed using pip. How it works is listed here, as well as an explanation of how to use it. For an even more in-depth introduction to using the ohsome-py package, you can check out this use case about public green spaces.
A request with ohsome-py could look like this:
import ohsome
import geopandas as gpd
client = ohsome.OhsomeClient()

bpolys = gpd.read_file("/yourpath/yourboundary.geojson")
example = client.elements.count.post(bpolys=bpolys,
                                      time='2010-01-01/2021-11-01/P1M',
                                      filter="type:way and building=school")
example_df = response.as_dataframe()
Access via R with the ohsome R package:
If you prefer to work with R, don’t worry, we have got you covered! One other of our projects is the ohsome R package, which allows you to send requests to the ohsome API via R. Again, you can find a very detailed explanation on how to install and use it here.
The ohsome R package is currently at an experimental stage. You can install it from Github. While all kinds of queries to the ohsome API are possible with the package, it works most comfortably for OSM elements aggregation at the moment. A new version with full functionality is expected to be submitted to CRAN in the very near future.
A request with the ohsome R package could look like this:
library(ohsome)
library(sf)

htbo_example <- read_sf("yourboundary.geojson")
query <- ohsome_elements_count(
    boundary = htbo_example,
    filter = "type:way and building=school",
    time="2010-01-01/2021-11-01/P1M"
)
example <- ohsome_post(query)
Access via ohsomeTools:
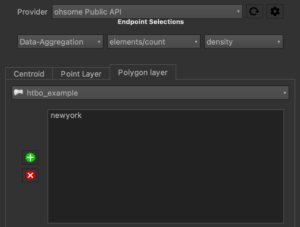
If you want to analyze your data with QGIS and visualize it on a map, then the ohsome QGIS Plug-In (ohsomeTools) is the right tool for you. With it you can access the ohsome API directly in QGIS instead of sending a separate request and loading the data into your GIS. Please note that only QGIS v3.14 or newer is supported!
A very convenient feature of this tool is the automatic activation of the QGIS native temporal controller, if the geometry is suitable. Note that ohsomeTools has not yet been released in a public repository, but this will happen as soon as a suitable version of it is ready.
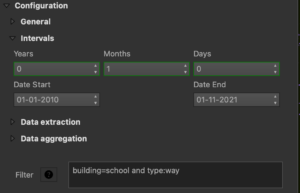
Again, you can find a short introduction on how to install and use the tool here. As you will surely notice, sending a request as well as using the output-file, is possible with very few clicks and in short time, which makes this tool a great addition for QGIS based examinations.
A request with ohsomeTools could look like this:
Access via ohsome2x:
Last but not least, our nodeJS client “ohsome2x” must not be left out. It allows you to access the ohsome API and store the output using either a command-line tool called “ohsome2x-cli”, or you can use it as library in your nodeJS scripts (JavaScript and TypeScript). For a small number of boundaries, you can request the ohsome API in one go and store the results in a simple GeoJSON output file, but the strength of ohsome2x is batch processing of thousands or millions of boundaries coming from a PostGIS DB. ohsome2x can then step by step query the ohsome API with parts of your input data and also cares about storage and useful indexing of the results in a PostGIS output table.
Of course you can find more information about installation and usage on the npm-registry and it’s repository.
A request with ohsome2x could look like this:
{
  "ohsomeQuery": {
    "queryType": "elements/count/groupBy/boundary",
    "filter": "building=school and type:way",
    "time": "2010-01-01/2021-11-01/P1M"
  },
  "source": {
    "geometryId": "id",
    "name": "yourboundary.geojson",
    "store": { "path": "yourboundary.geojson", "type": "geojson" }
  },
  "target": {
    "horizontalTimestampColumns": false,
    "createGeometry": true,
    "transformToWebmercator": false,
    "storeZeroValues": true,
    "computeValuePerArea": true,
    "name": "htbo_ohsome2x_example_output.geojson",
    "store": { "path": "htbo_ohsome2x_example_output.geojson",
    "type": "geojson" }
  }
}
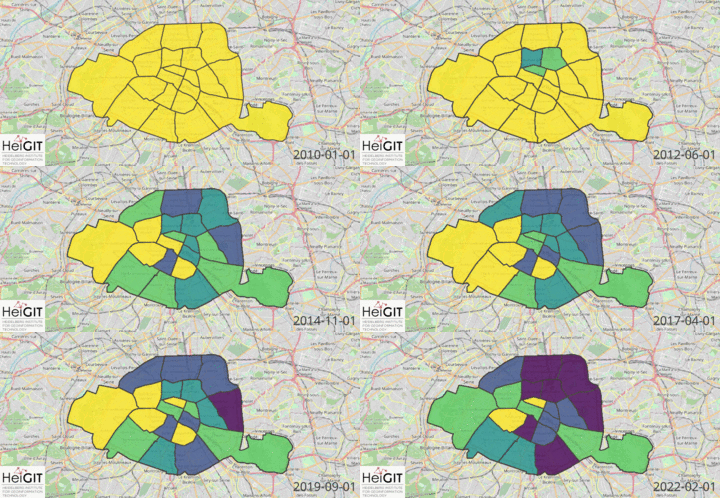
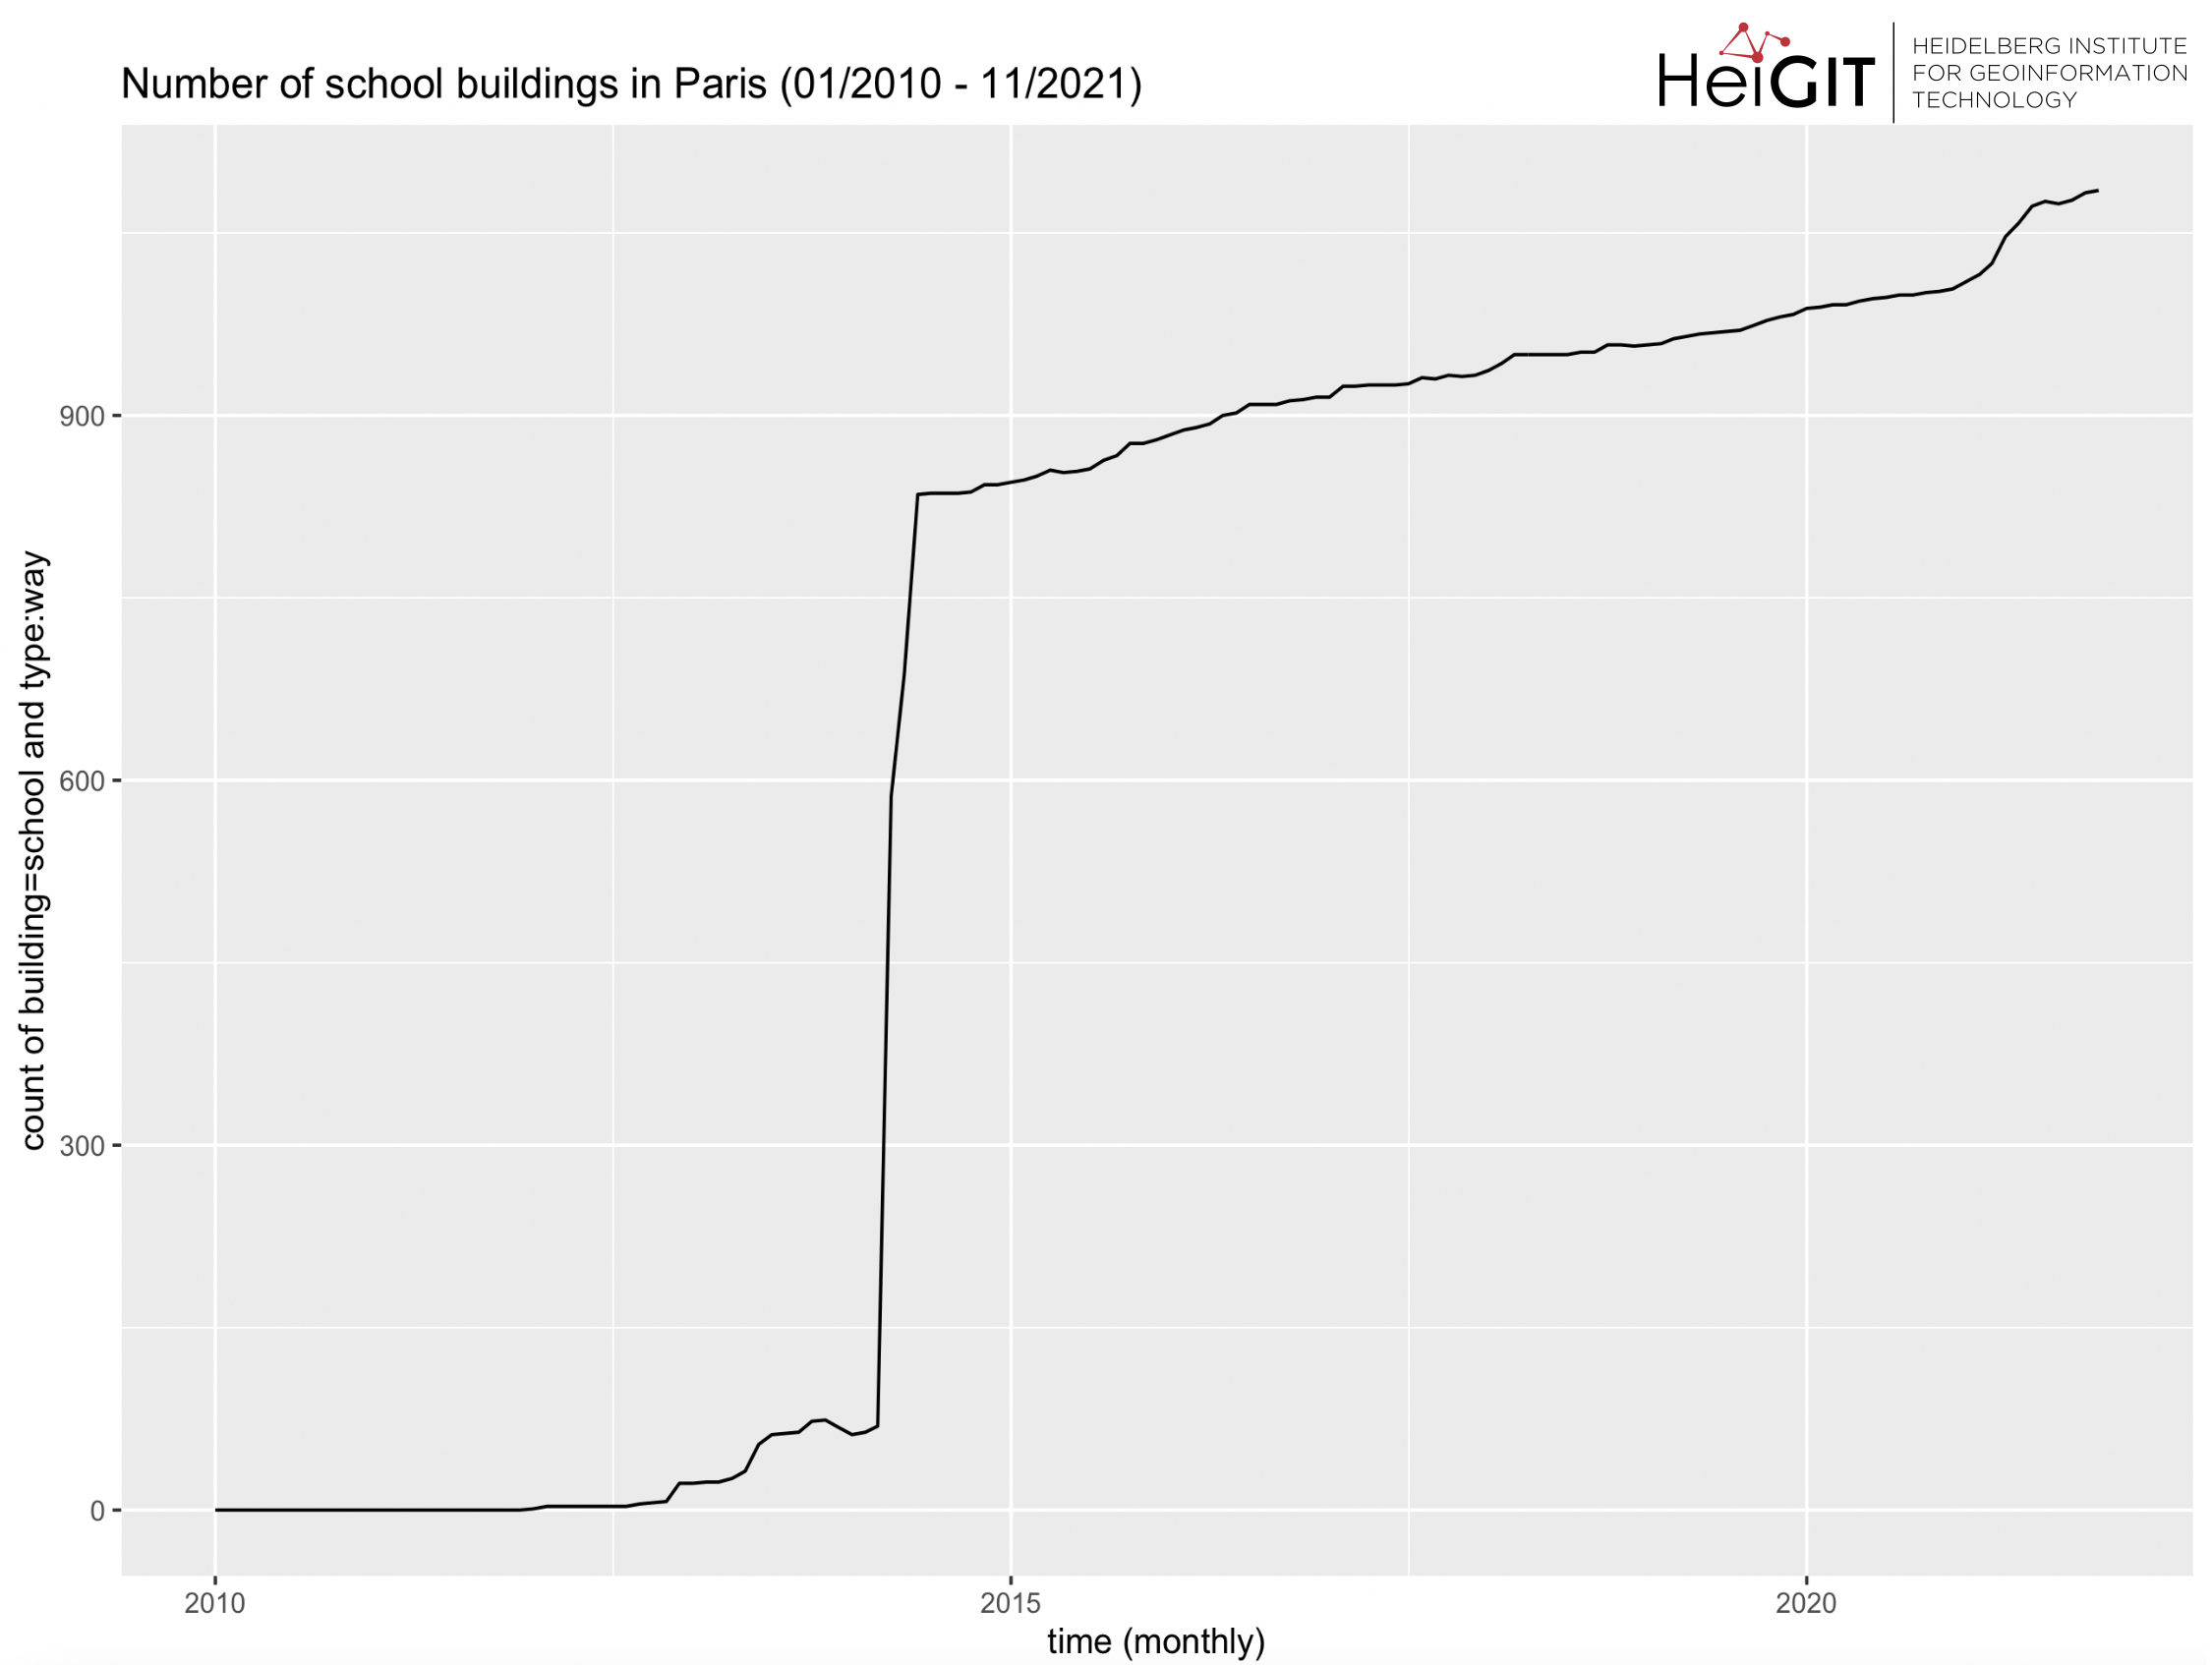
Below you can see visualizations of the output dataset from our example request (count of school-buildings):
This first visualization was created with the OSM Boundaries for the arrondissements of Paris, the request was sent with ohsome2x and the visualization was generated with QGIS.
The second visualization used the OSM boundaries of Paris as well, the request and plot were both generated with R.
Thank you for reading our new blog post of the “How to become ohsome” series! We hope it was a helpful addition to the previous posts.
Background info: the aim of the ohsome OpenStreetMap History Data Analytics Platform is to make OpenStreetMap’s full-history data more easily accessible for various kinds of OSM data analytics tasks, such as data quality analysis, on a regional, country-wide, or global scale. The ohsome API is one of its components, providing free and easy access to some of the functionalities of the ohsome platform via HTTP requests. Some intro can be found here:
- ohsome general idea
- ohsome general architecture
- how spatial joins queries work in the OpenStreetMap History Database OSHDB
- Raifer, Martin; Troilo, Rafael; Kowatsch, Fabian; Auer, Michael; Loos, Lukas; Marx, Sabrina; Przybill, Katharina; Fendrich, Sascha; Mocnik, Franz-Benjamin; Zipf, Alexander (2019): OSHDB: a framework for spatio-temporal analysis of OpenStreetMap history data. Open Geospatial Data, Software and Standards.


