

Category: OSM
-
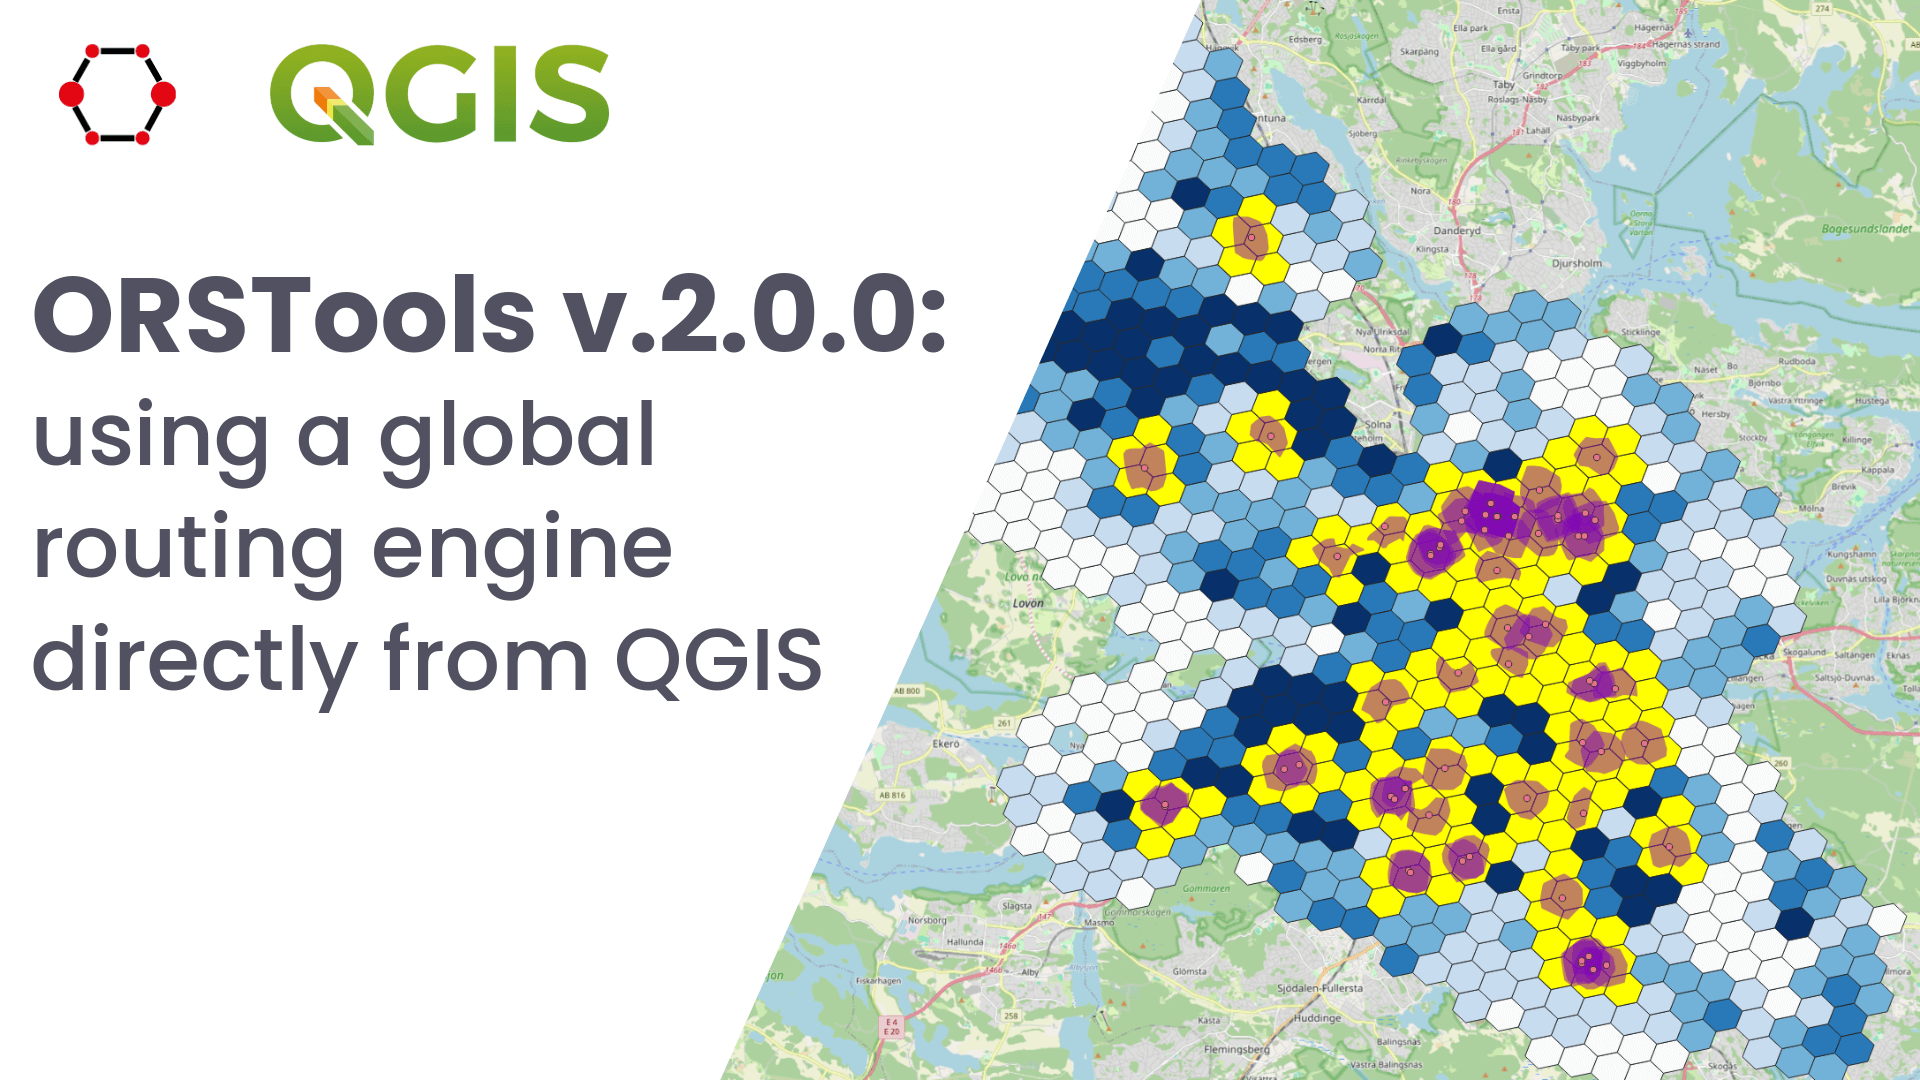
Release of QGIS plugin ORSTools v.2.0.0 & QGIS User Conference
What is ORSTools? With ORSTools, most of the functionalities of openrouteservice are directly accessible in QGIS. The plugin offers a toolset, including routing, isochrone generation and matrix calculations. These functions can be used interactively in the map canvas or applied to point files within the processing framework. Output files come with rich attribute data such…
-
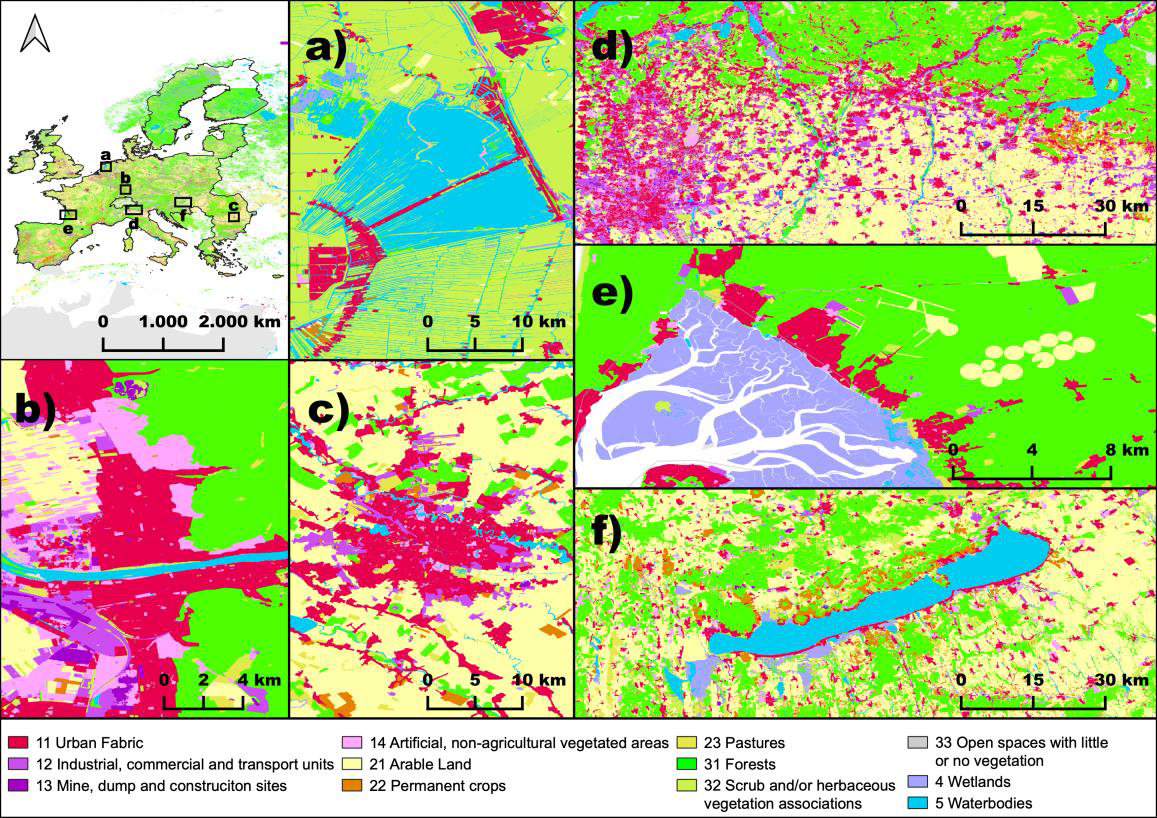
New Paper in Nature “OSMlanduse a dataset of European Union land use at 10 m resolution derived from OpenStreetMap and Sentinel-2”
The paper, published in Nature Scientific Data, presents the first high-resolution (10m or finer) land use map of the European Union derived from a large-scale fusion of OpenStreetMap (OSM) and Copernicus Sentinel-2 data. Leveraging citizen-generated data and remote sensing, the authors demonstrate a scalable and globally applicable methodology to fill thematic and spatial gaps in…
-
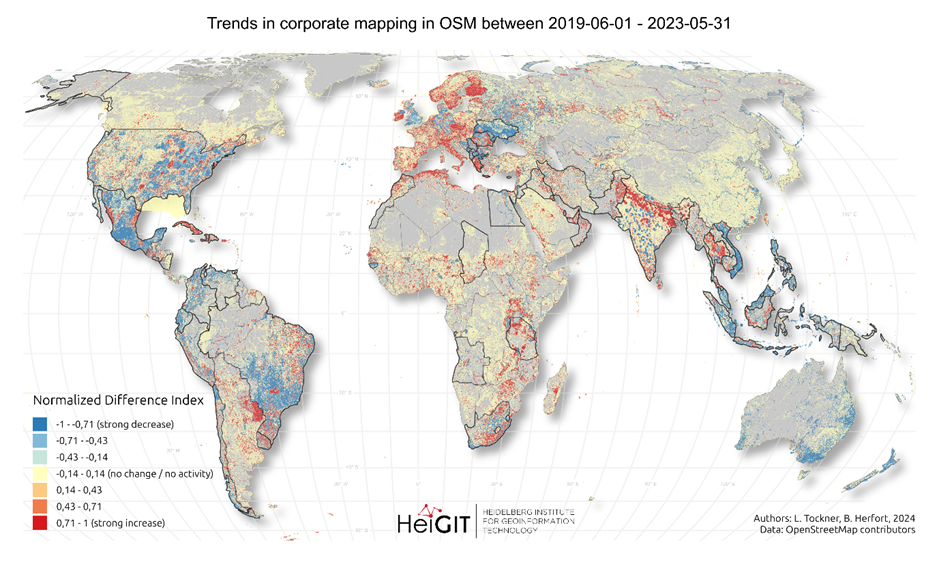
New paper “Corporate Mapping in OpenStreetMap – shifting trends in global evolution and small-scale effects”
Since 2016, corporate involvement in OpenStreetMap (OSM) has grown significantly, with major contributors such as Apple, Microsoft, Meta, and Amazon making substantial edits to the map on a global scale. These efforts have often focused on filling gaps in high- and medium-income countries, contributing to the overall growth of OSM data. However, this increasing corporate…
-
New Paper: “Paved or unpaved? A Deep Learning derived Road Surface Global Dataset from Mapillary Street-View Imagery”
The paper addresses the global shortage of detailed road surface data by leveraging street-view imagery from Mapillary and advanced deep learning techniques. Traditional datasets like OpenStreetMap (OSM) often lack comprehensive road surface attributes—with only about 30–40% coverage—hindering applications such as travel time estimation, disaster response routing, urban planning, and environmental assessments. To fill this gap,…
-
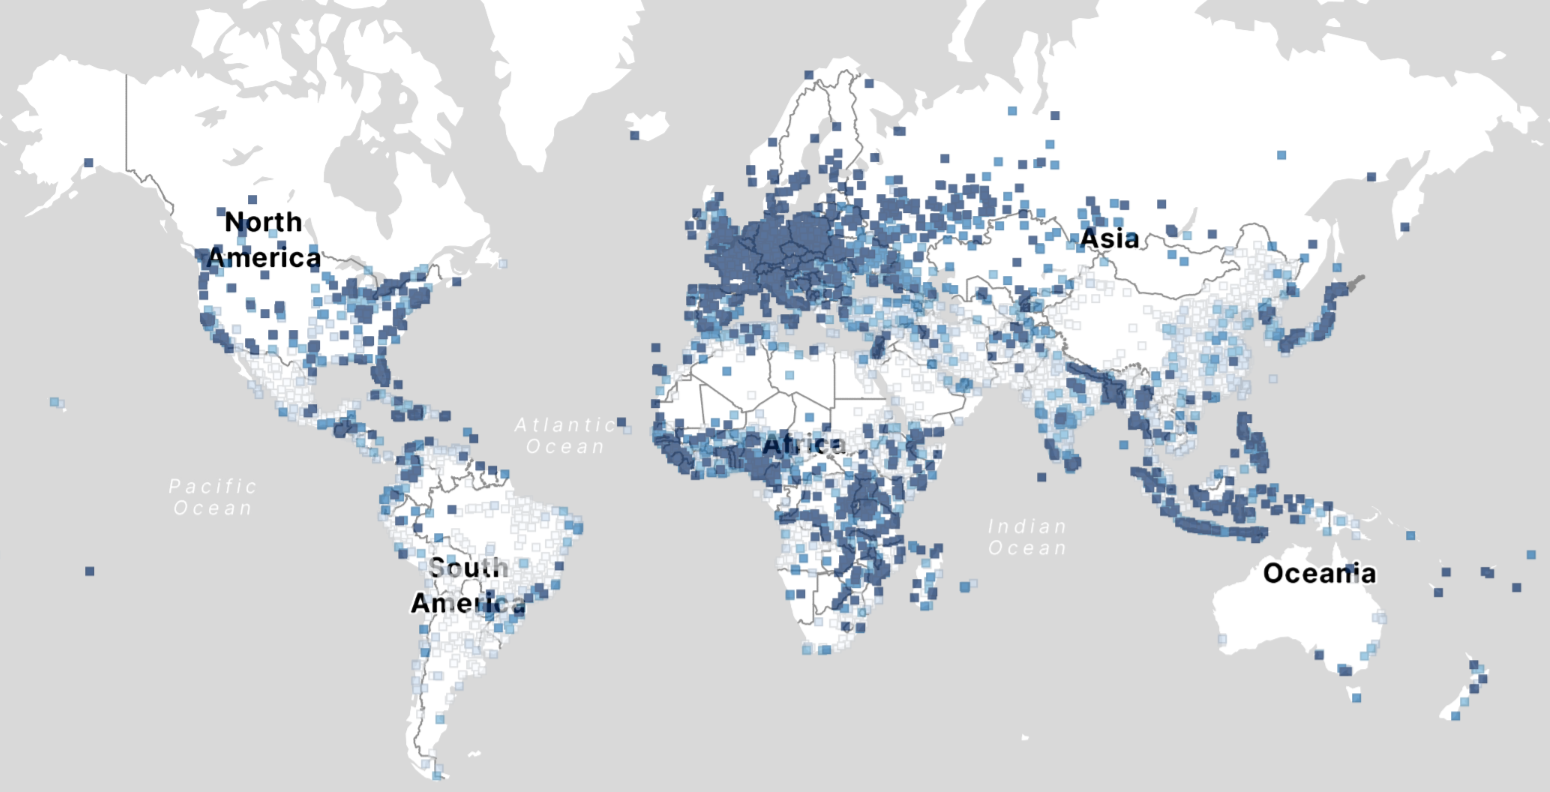
OSM Completeness with Overture maps data
Free and open-source map data has become a keystone for research across diverse fields. The extensive coverage of OpenStreetMap (OSM) data allows scientists to conduct independent studies without relying on corporate collaborations or investing heavily in proprietary datasets. However, OSM data coverage completeness varies significantly by location. Moreover, the latest data updates cannot always be…
-
ohsome-py 4.0.0
The ohsome-py Python package is a client for the ohsome API, designed to facilitate the extraction and analysis of historical OpenStreetMap (OSM) data. The package simplifies handling API requests and responses by converting them into pandas or GeoPandas data frames, making data analysis and visualization easier. With ohsome-py, you gain all the functionalities of the…
-
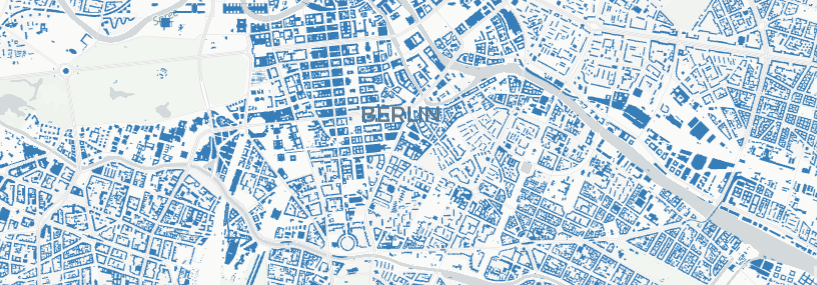
Analysis of OSM building data completeness using new data
With thousands of people mapping in OSM every day, missing building data in urban centers is steadily decreasing. Since OSM is a widely used source for projects researching urban phenomena around the world, a good data quality and an even distribution are important factors. If a spatial bias is present but not accounted for, researchers…
-
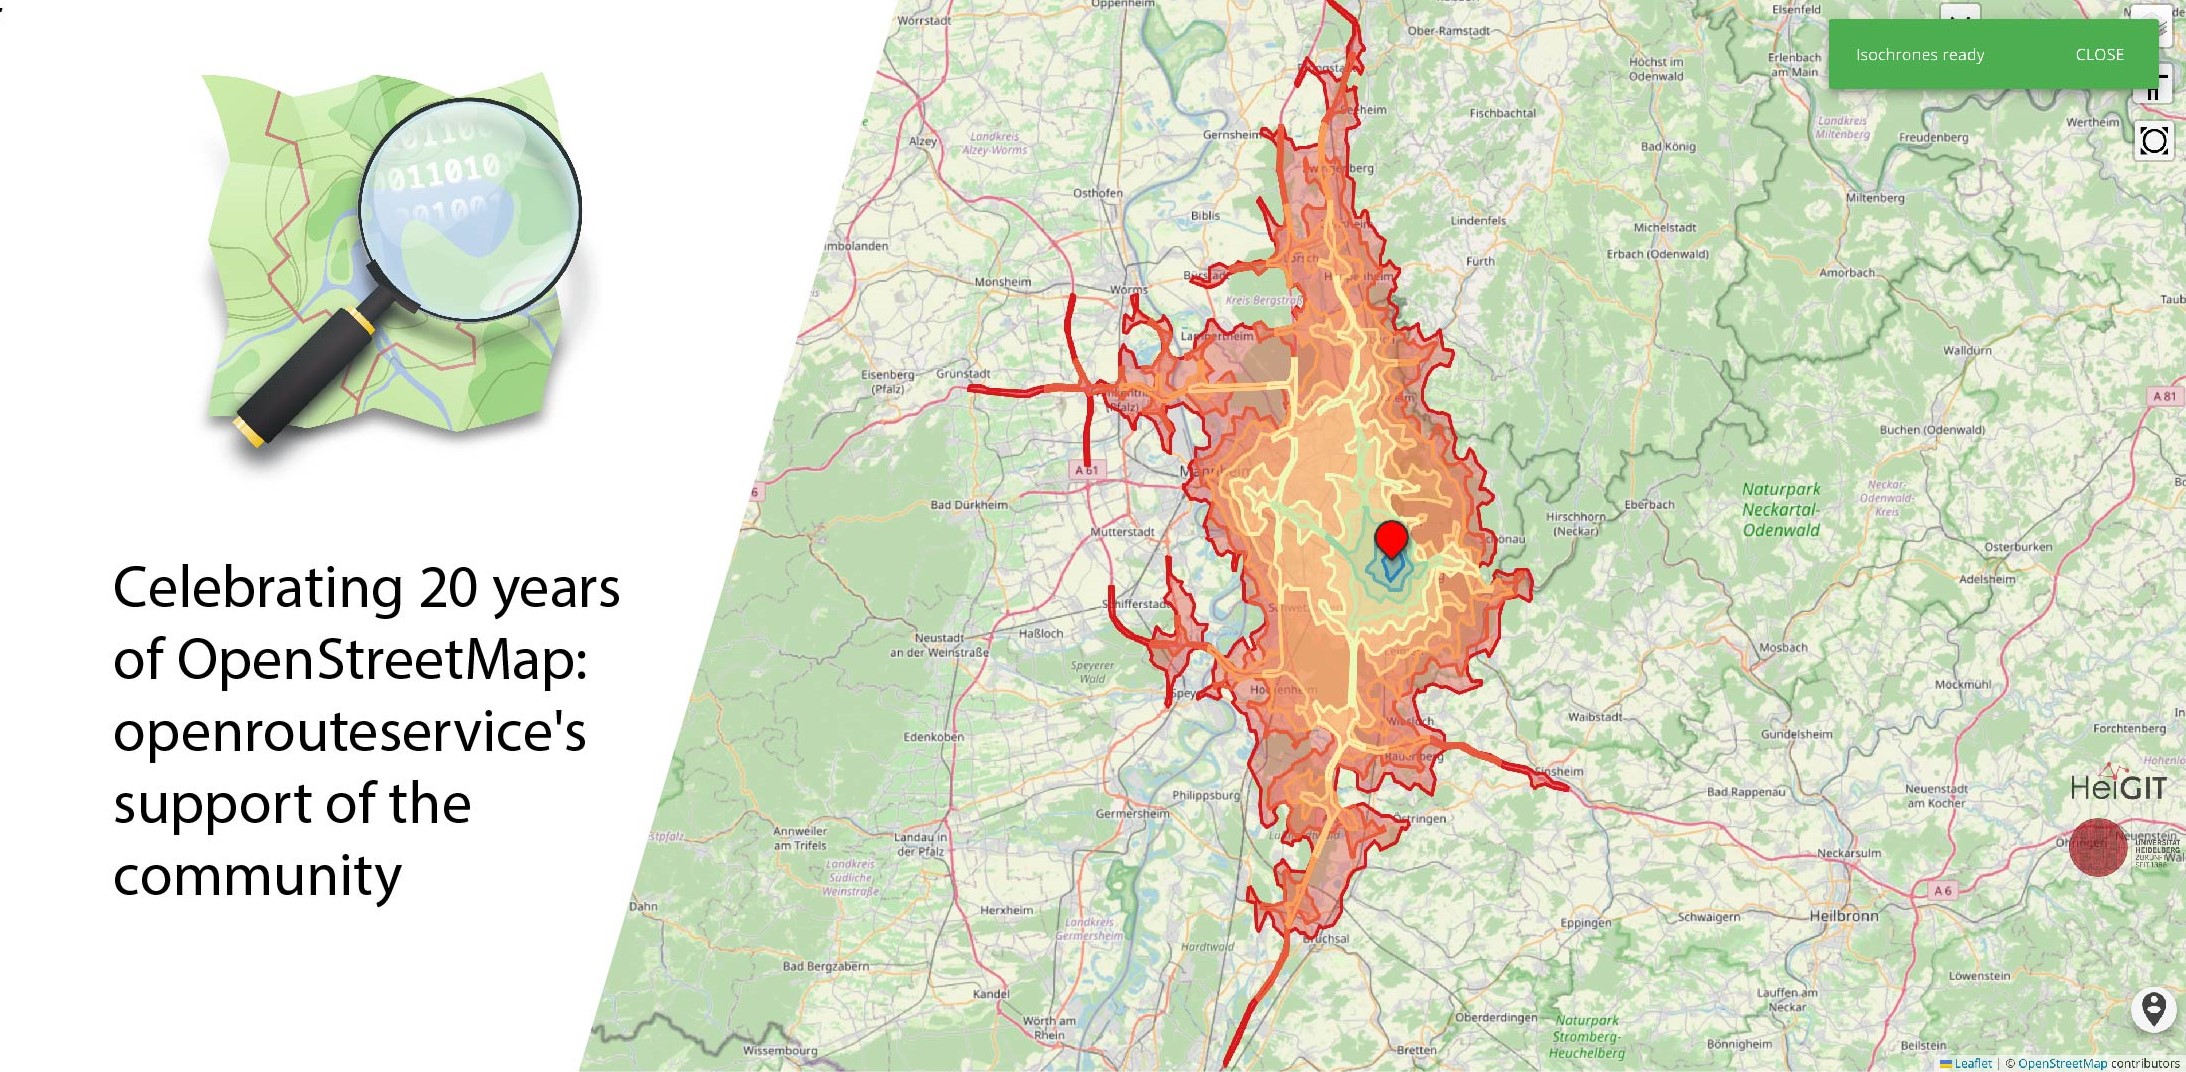
Celebrating 20 Years of OpenStreetMap: Openrouteservice’s Support of the Community
August 9 marks a turning point for the global mapping community: the 20th anniversary of OpenStreetMap (OSM). For two decades, OSM has revolutionized the way we perceive and interact with maps, transforming them from static representations to dynamic, community-driven resources. OpenStreetMap began as a visionary project aimed at creating a free, editable map of the…
-
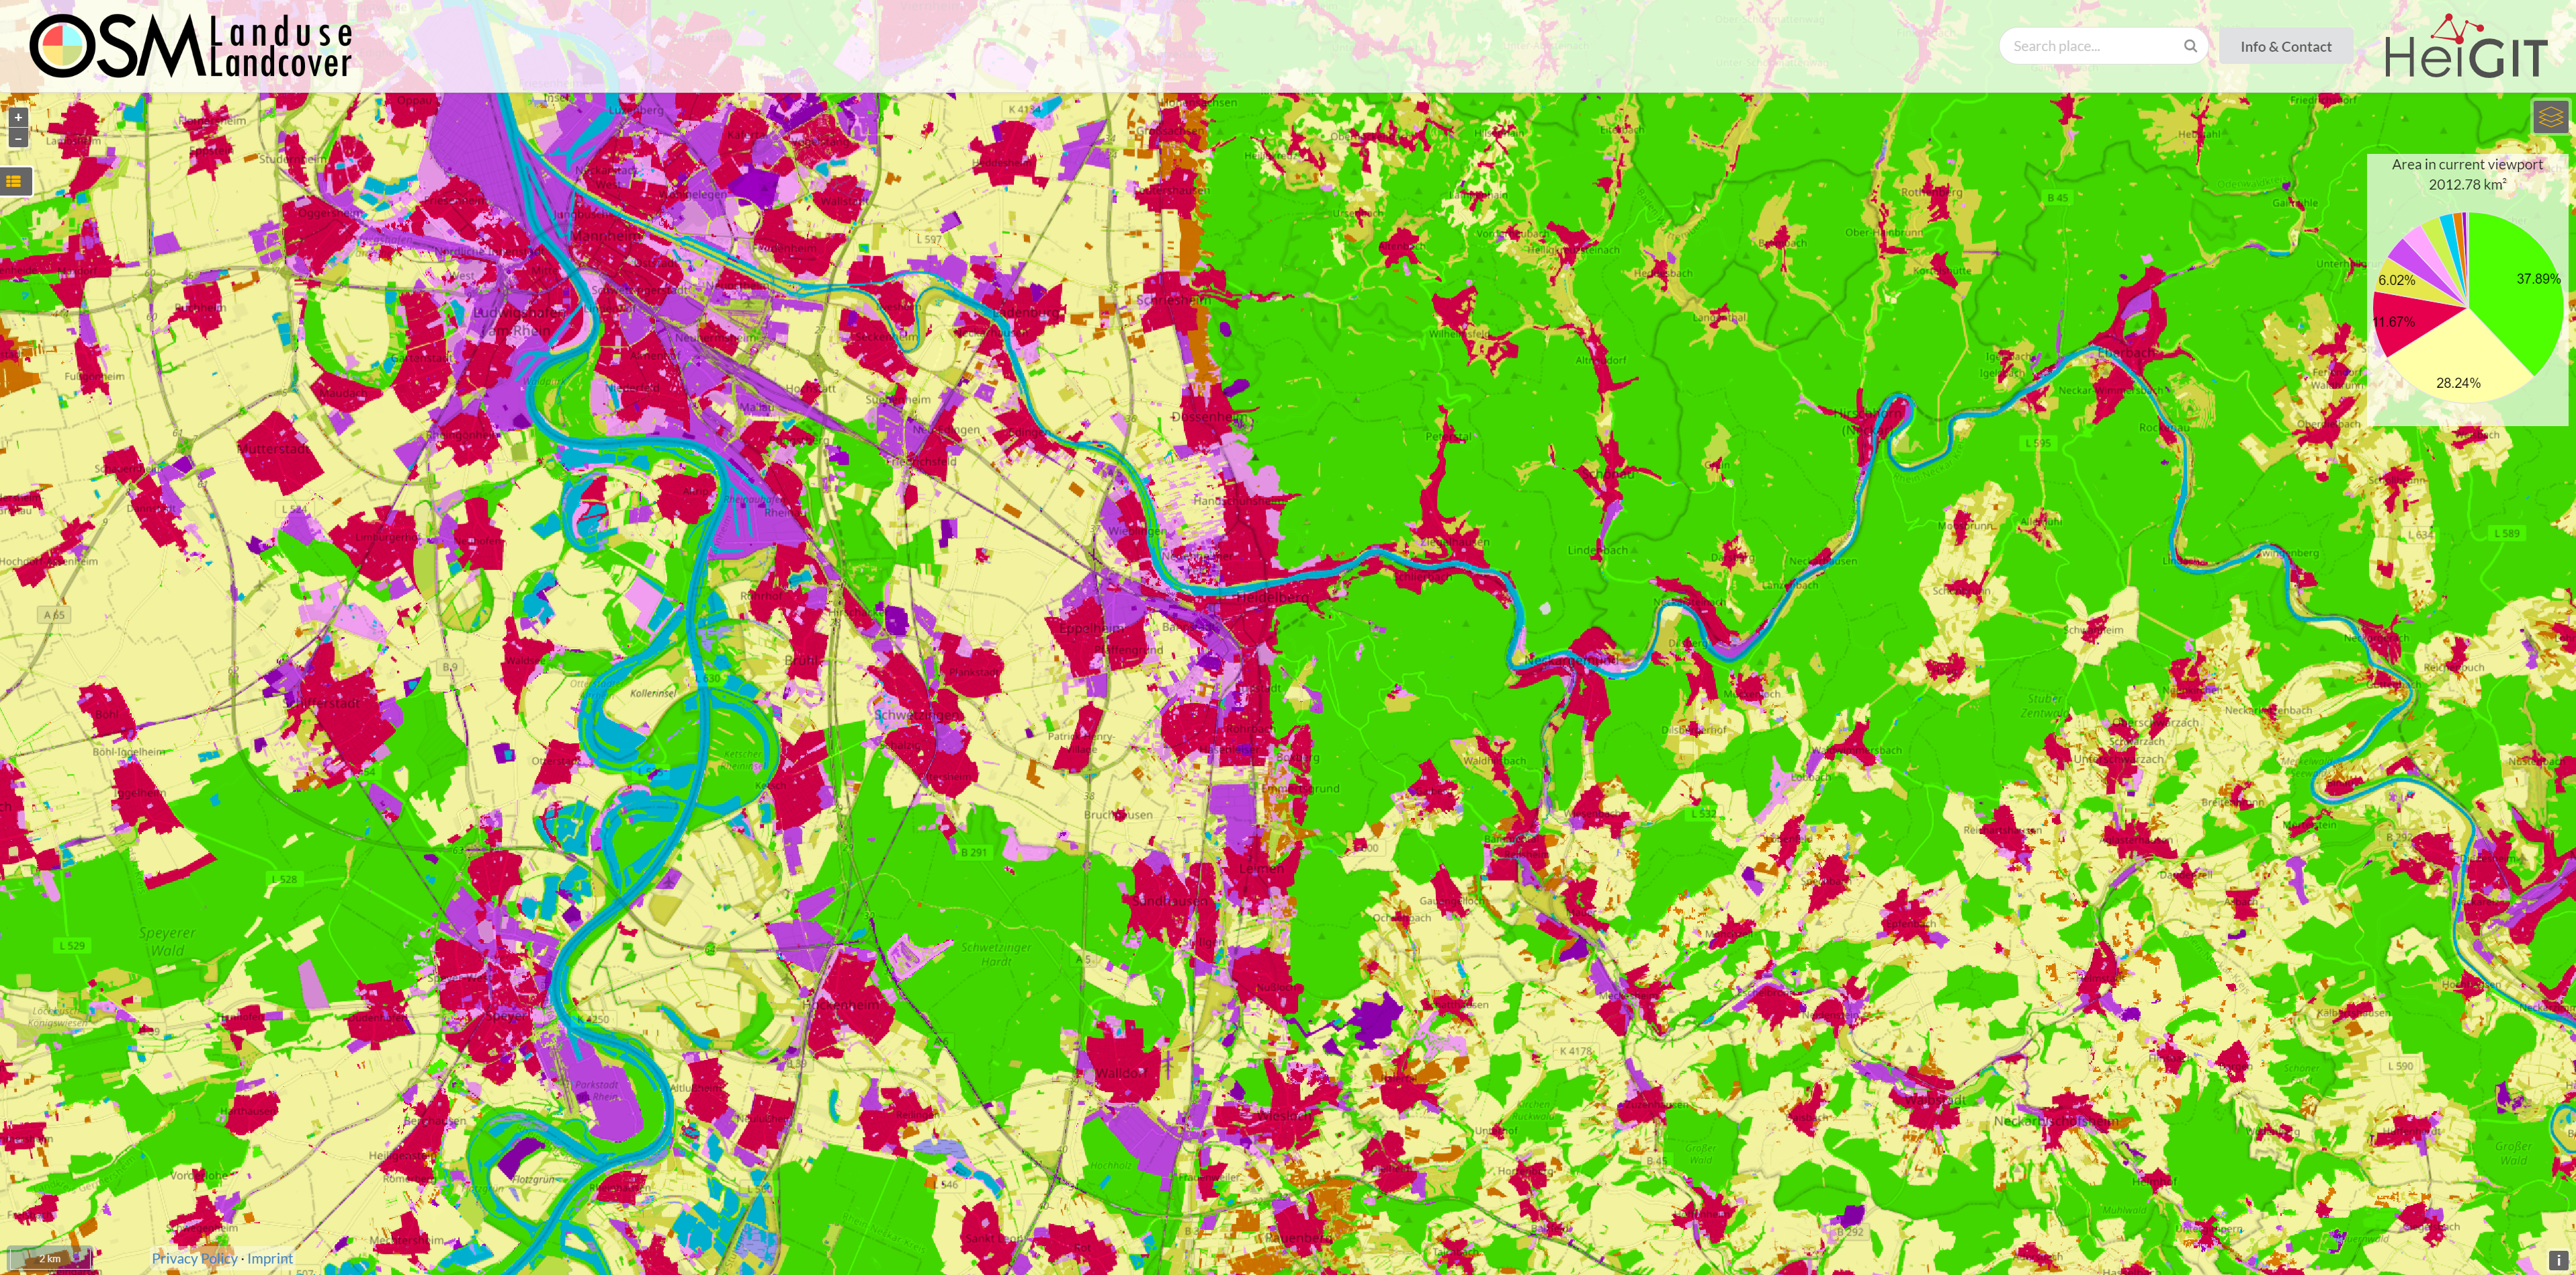
OSM Landuse Data is available in HeiData
We are excited to announce that the data displayed on OSM – Landuse is now freely accessible. These data sets offer valuable insights and can be utilized for various applications. Urban planners will find the data useful for development projects and zoning regulations, while environmental researchers can study land use changes and their impact on…
-
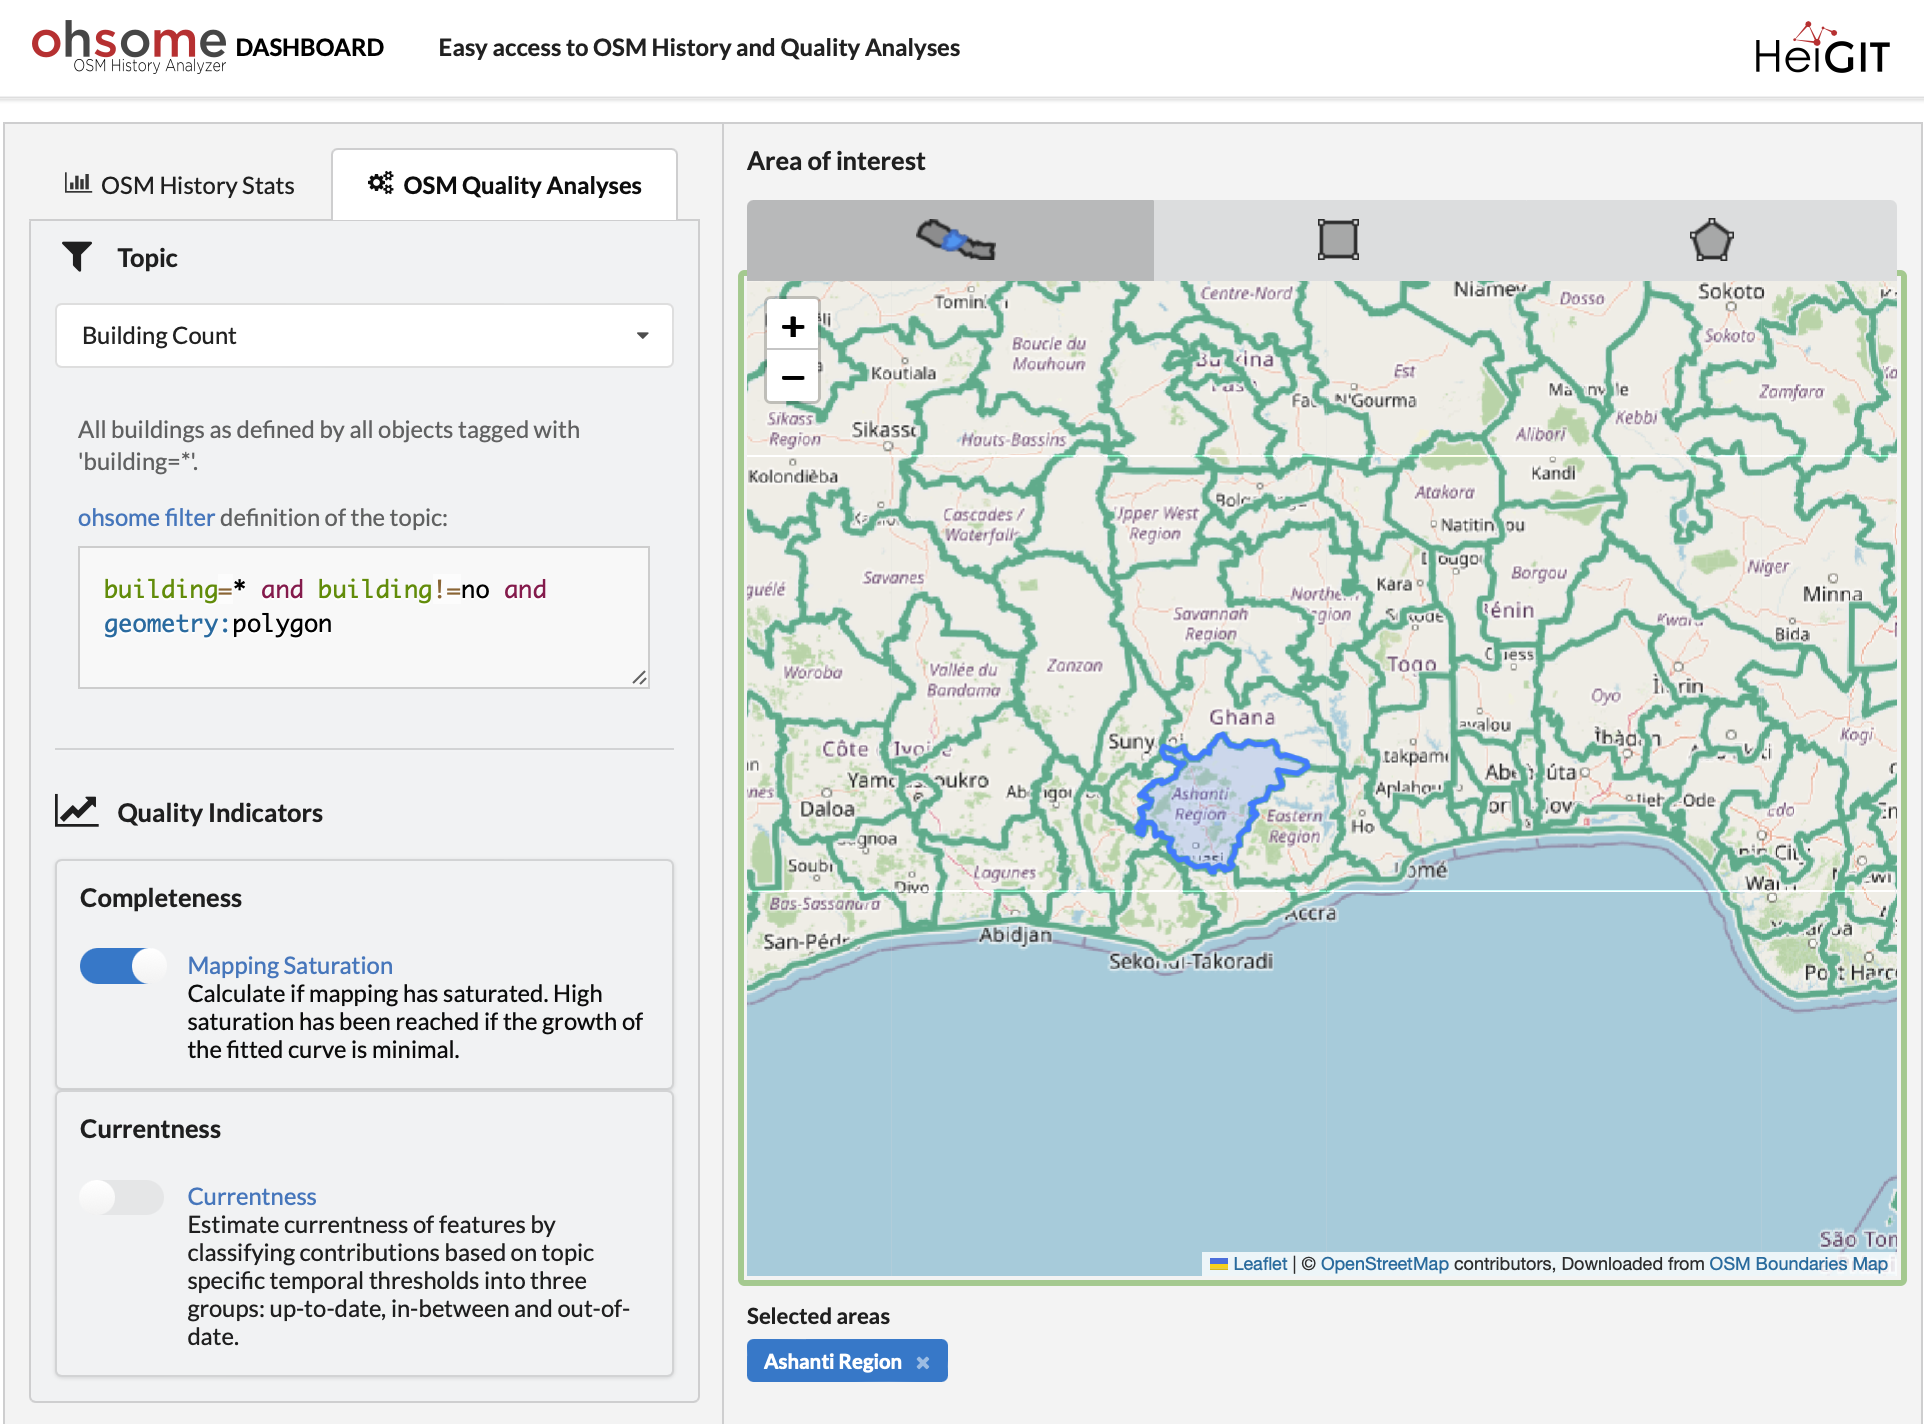
ohsome Quality API: New Features
Are you ready to take your OpenStreetMap (OSM) data analysis to the next level? We’re excited to showcase the latest features of our ohsome Dashboard, designed to provide you with insights into OSM data quality. With the ohsome Dashboard, analyzing OSM data has never been easier. Whether you’re interested in evaluating mapping saturation, currentness, or…
-
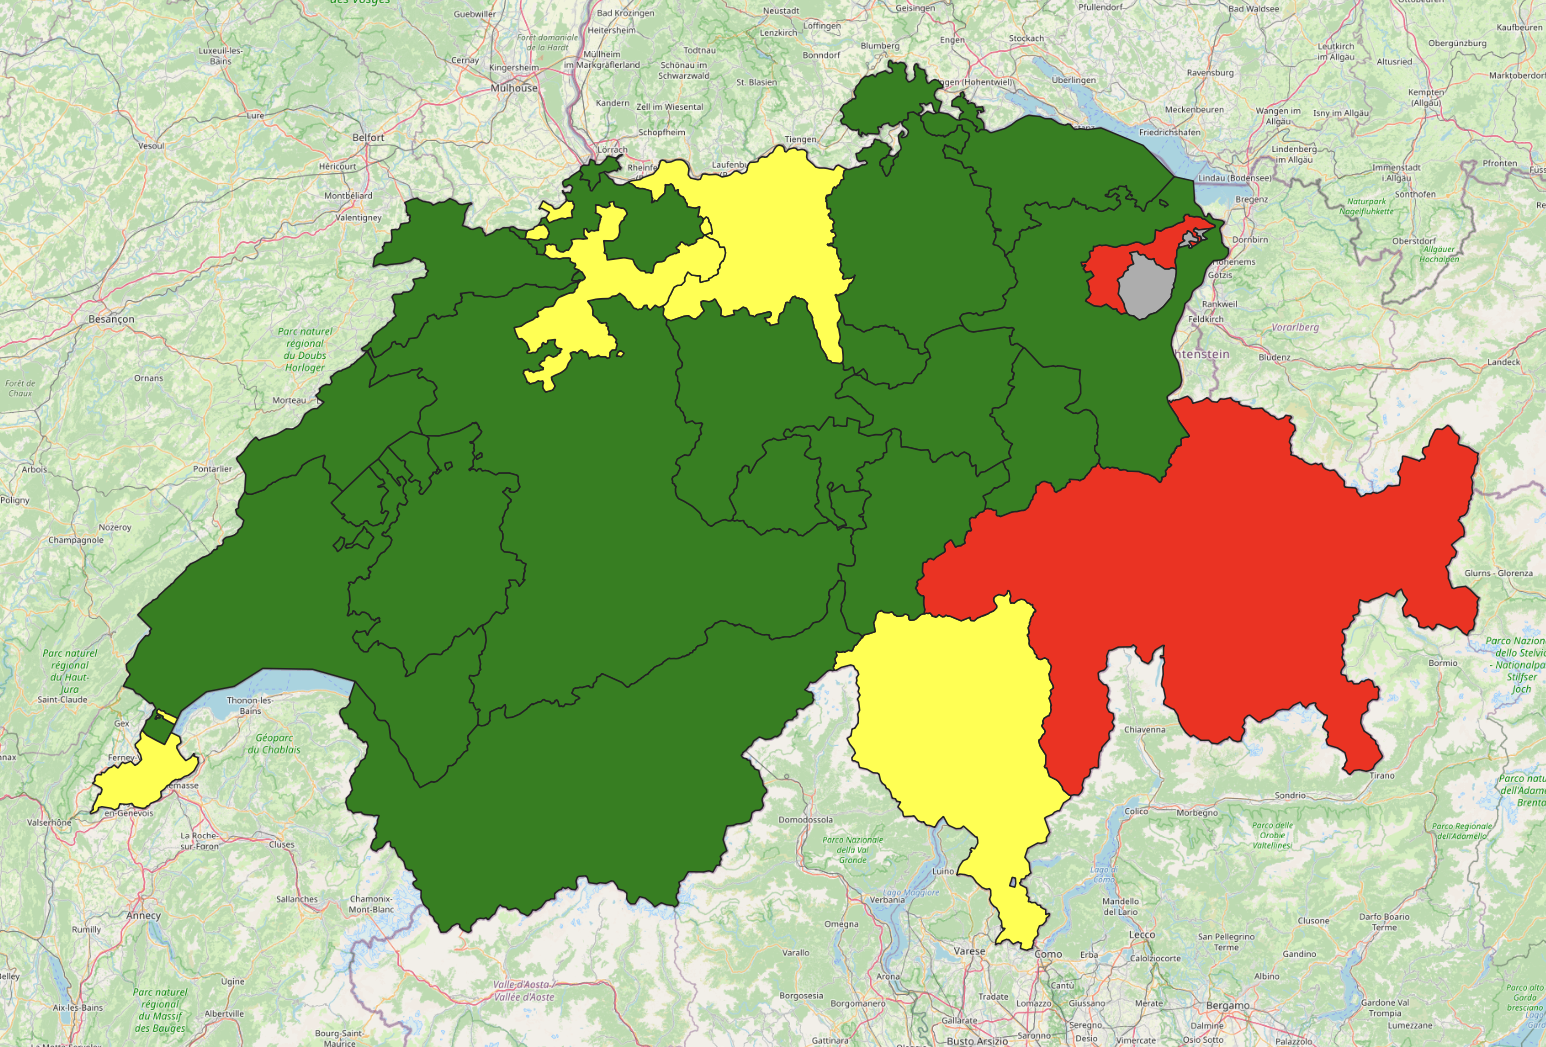
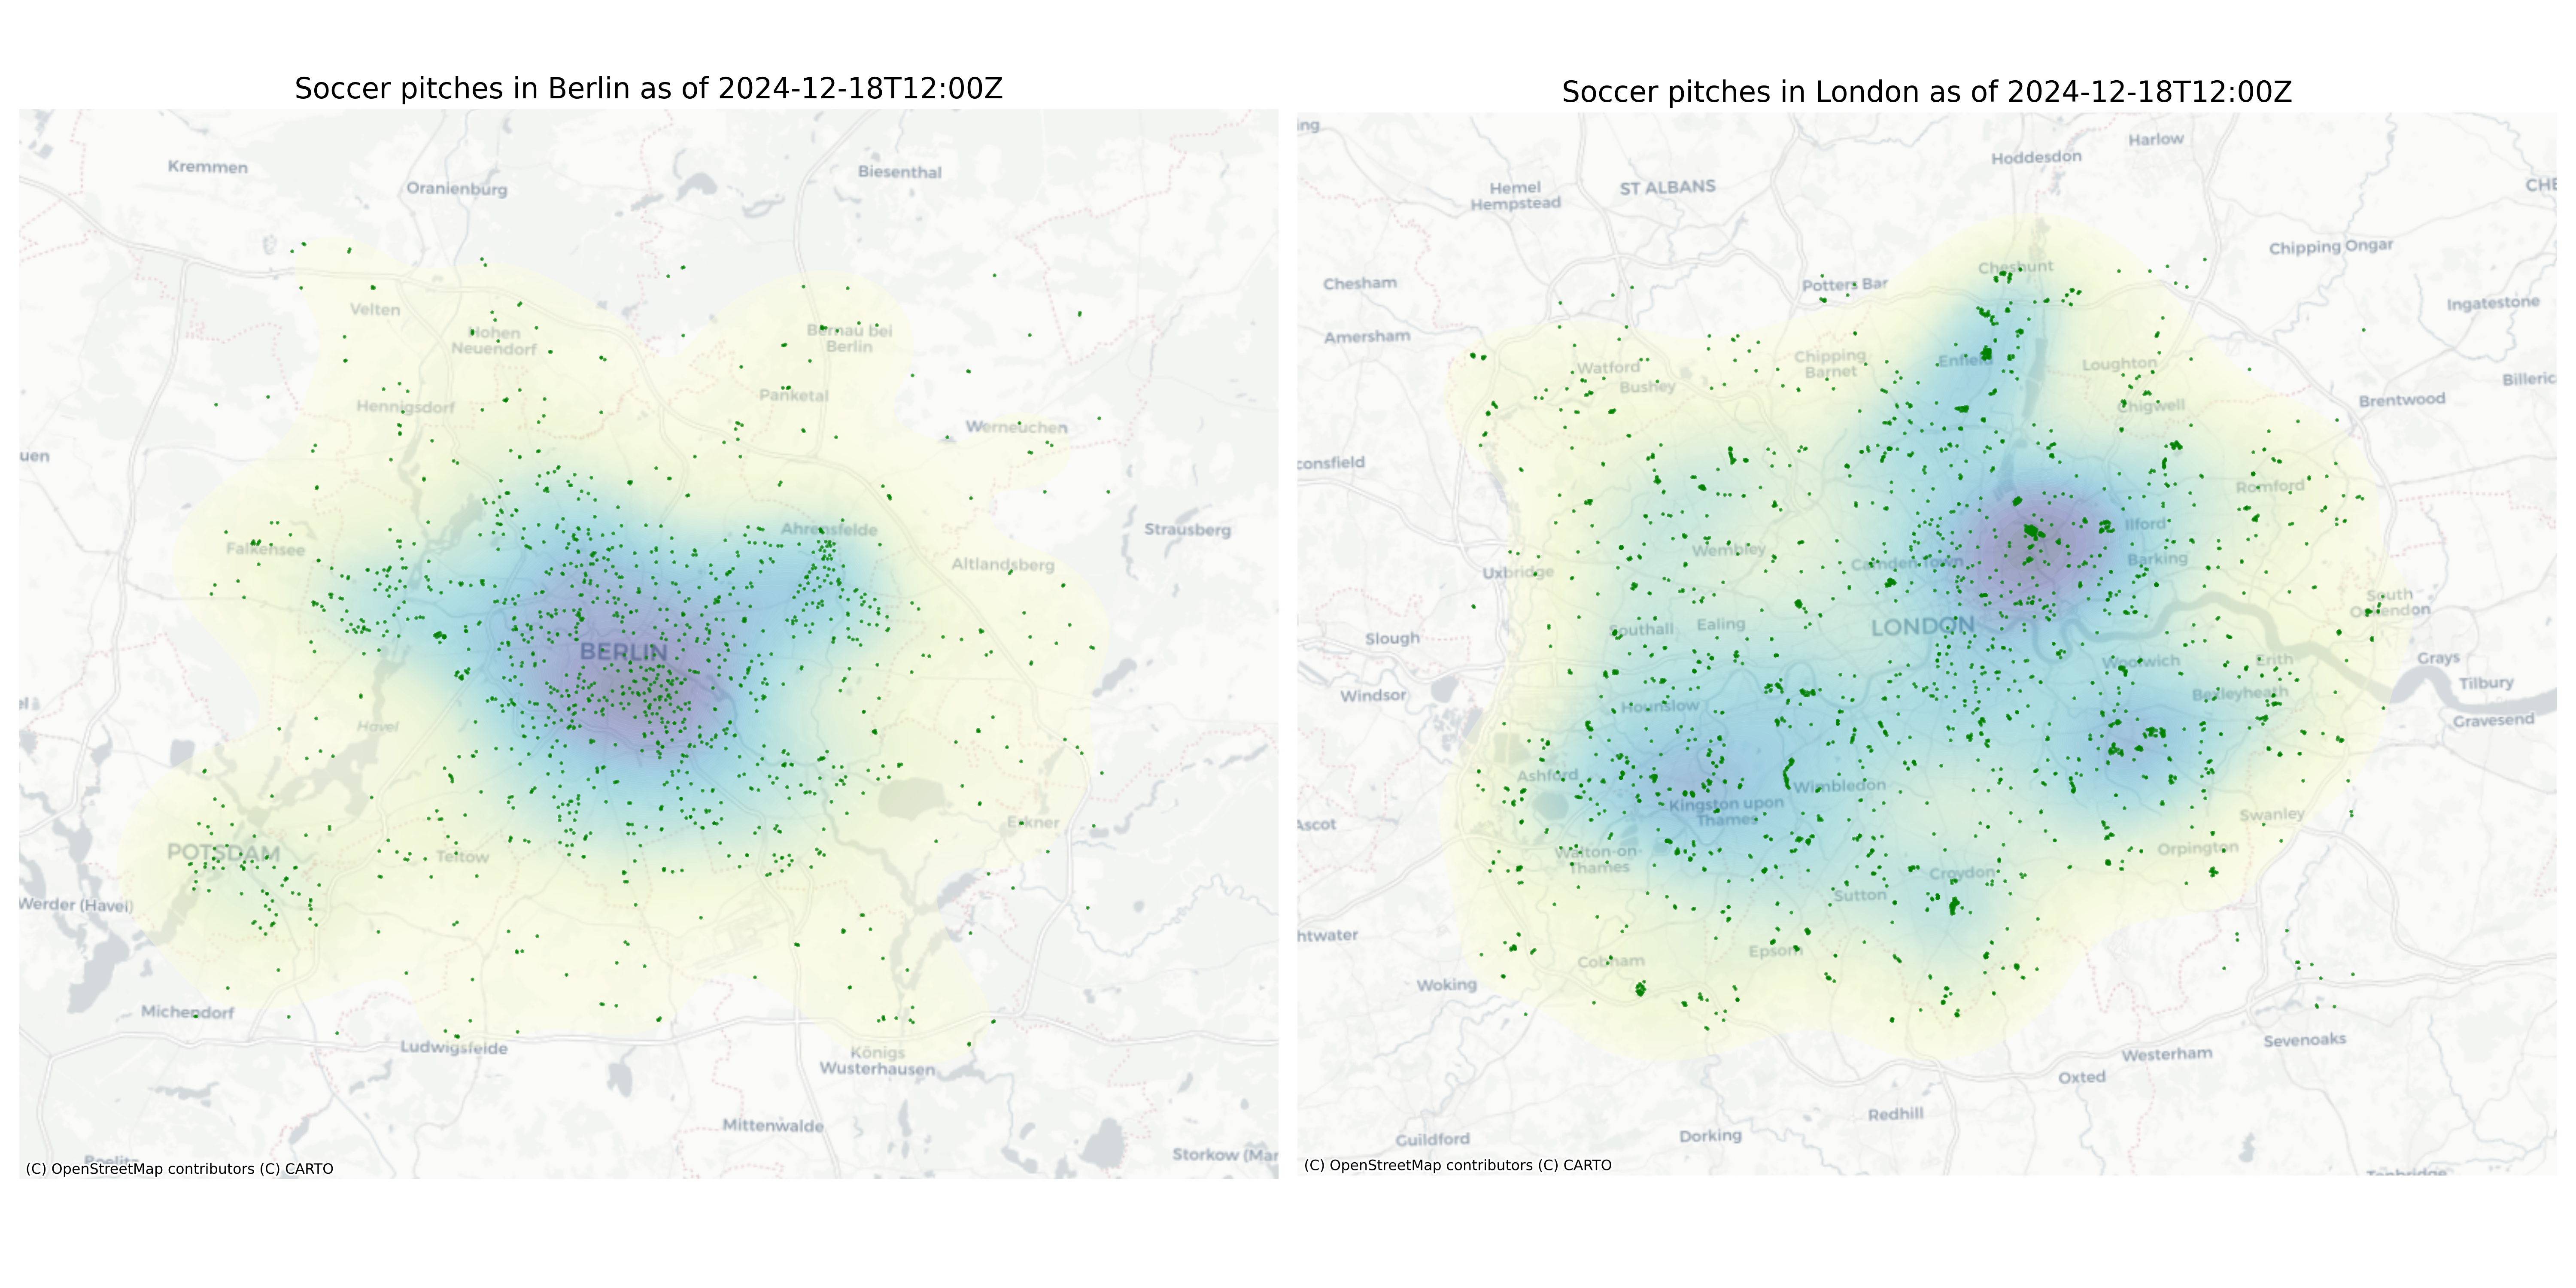
OQT for Food Environments
HeiGIT and the Amsterdam University Medical Centers (UMC) partnered up to investigate food environments through the lens of OpenStreetMap (OSM) data. UMC analyses how exposure to different categories of food related retailers affects health matters. The assumption is that the distance to retailers of a certain category, as well as the number of these retailers,…
-
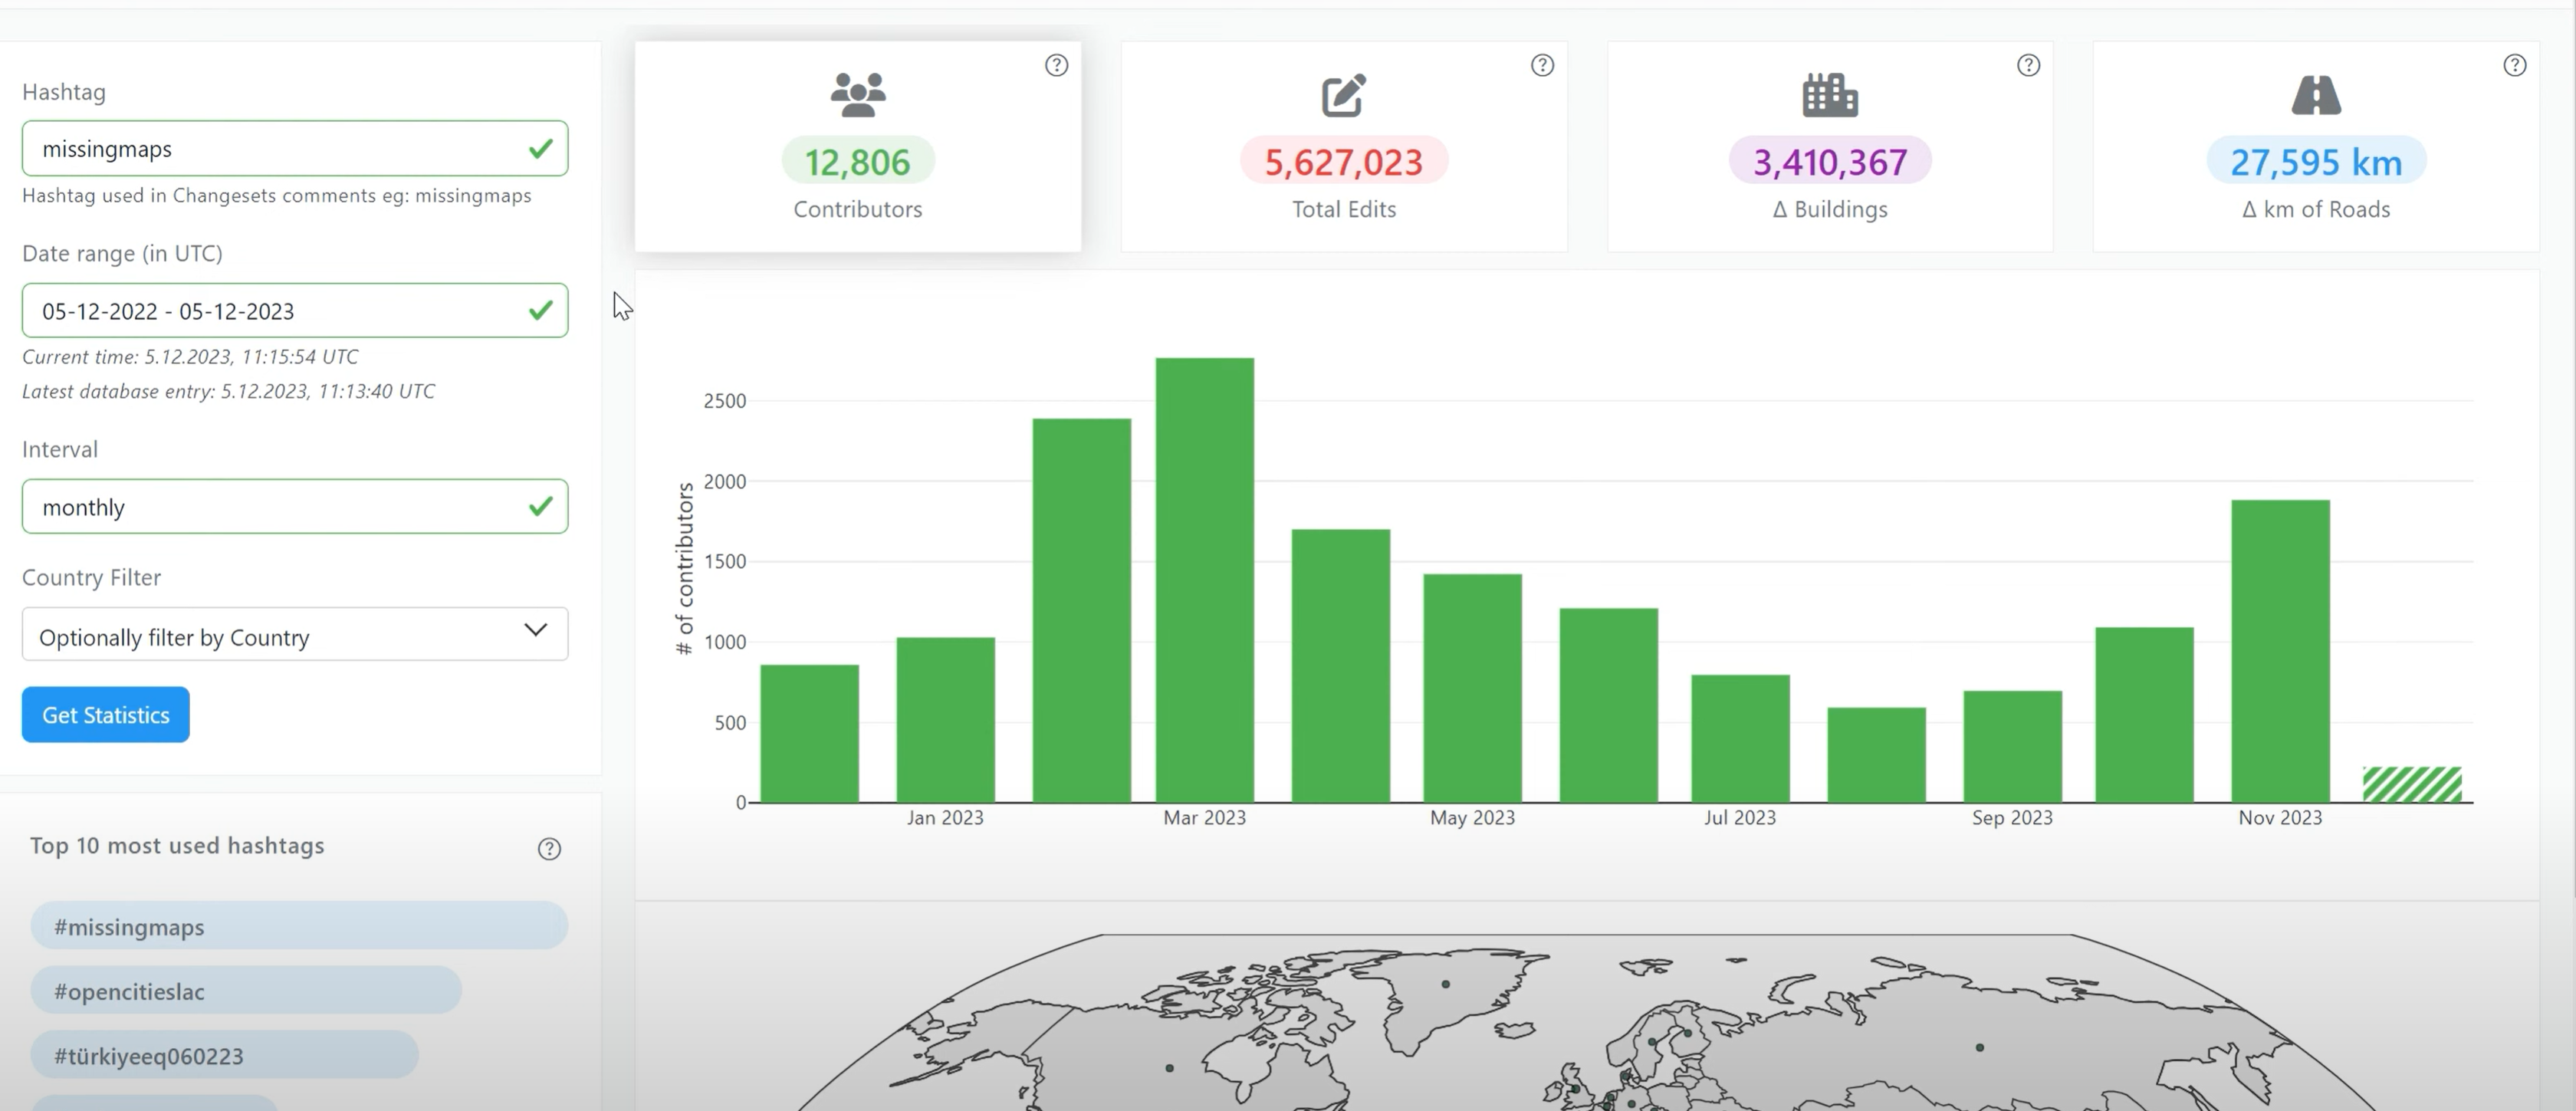
Introducing OhsomeNowStats
OhsomeNowStats allows users to take a look at the mapping activity in OpenStreetMap. This is especially useful for humanitarian organizations and mapathon organizers, because OhsomeNowStats data is updated every 5-10 minutes. Using this tool, user-engagement can be tracked in near real time and used to motivate participants and volunteers alike! By selecting a time range,…