

Tag: IDEAL-VGI
-
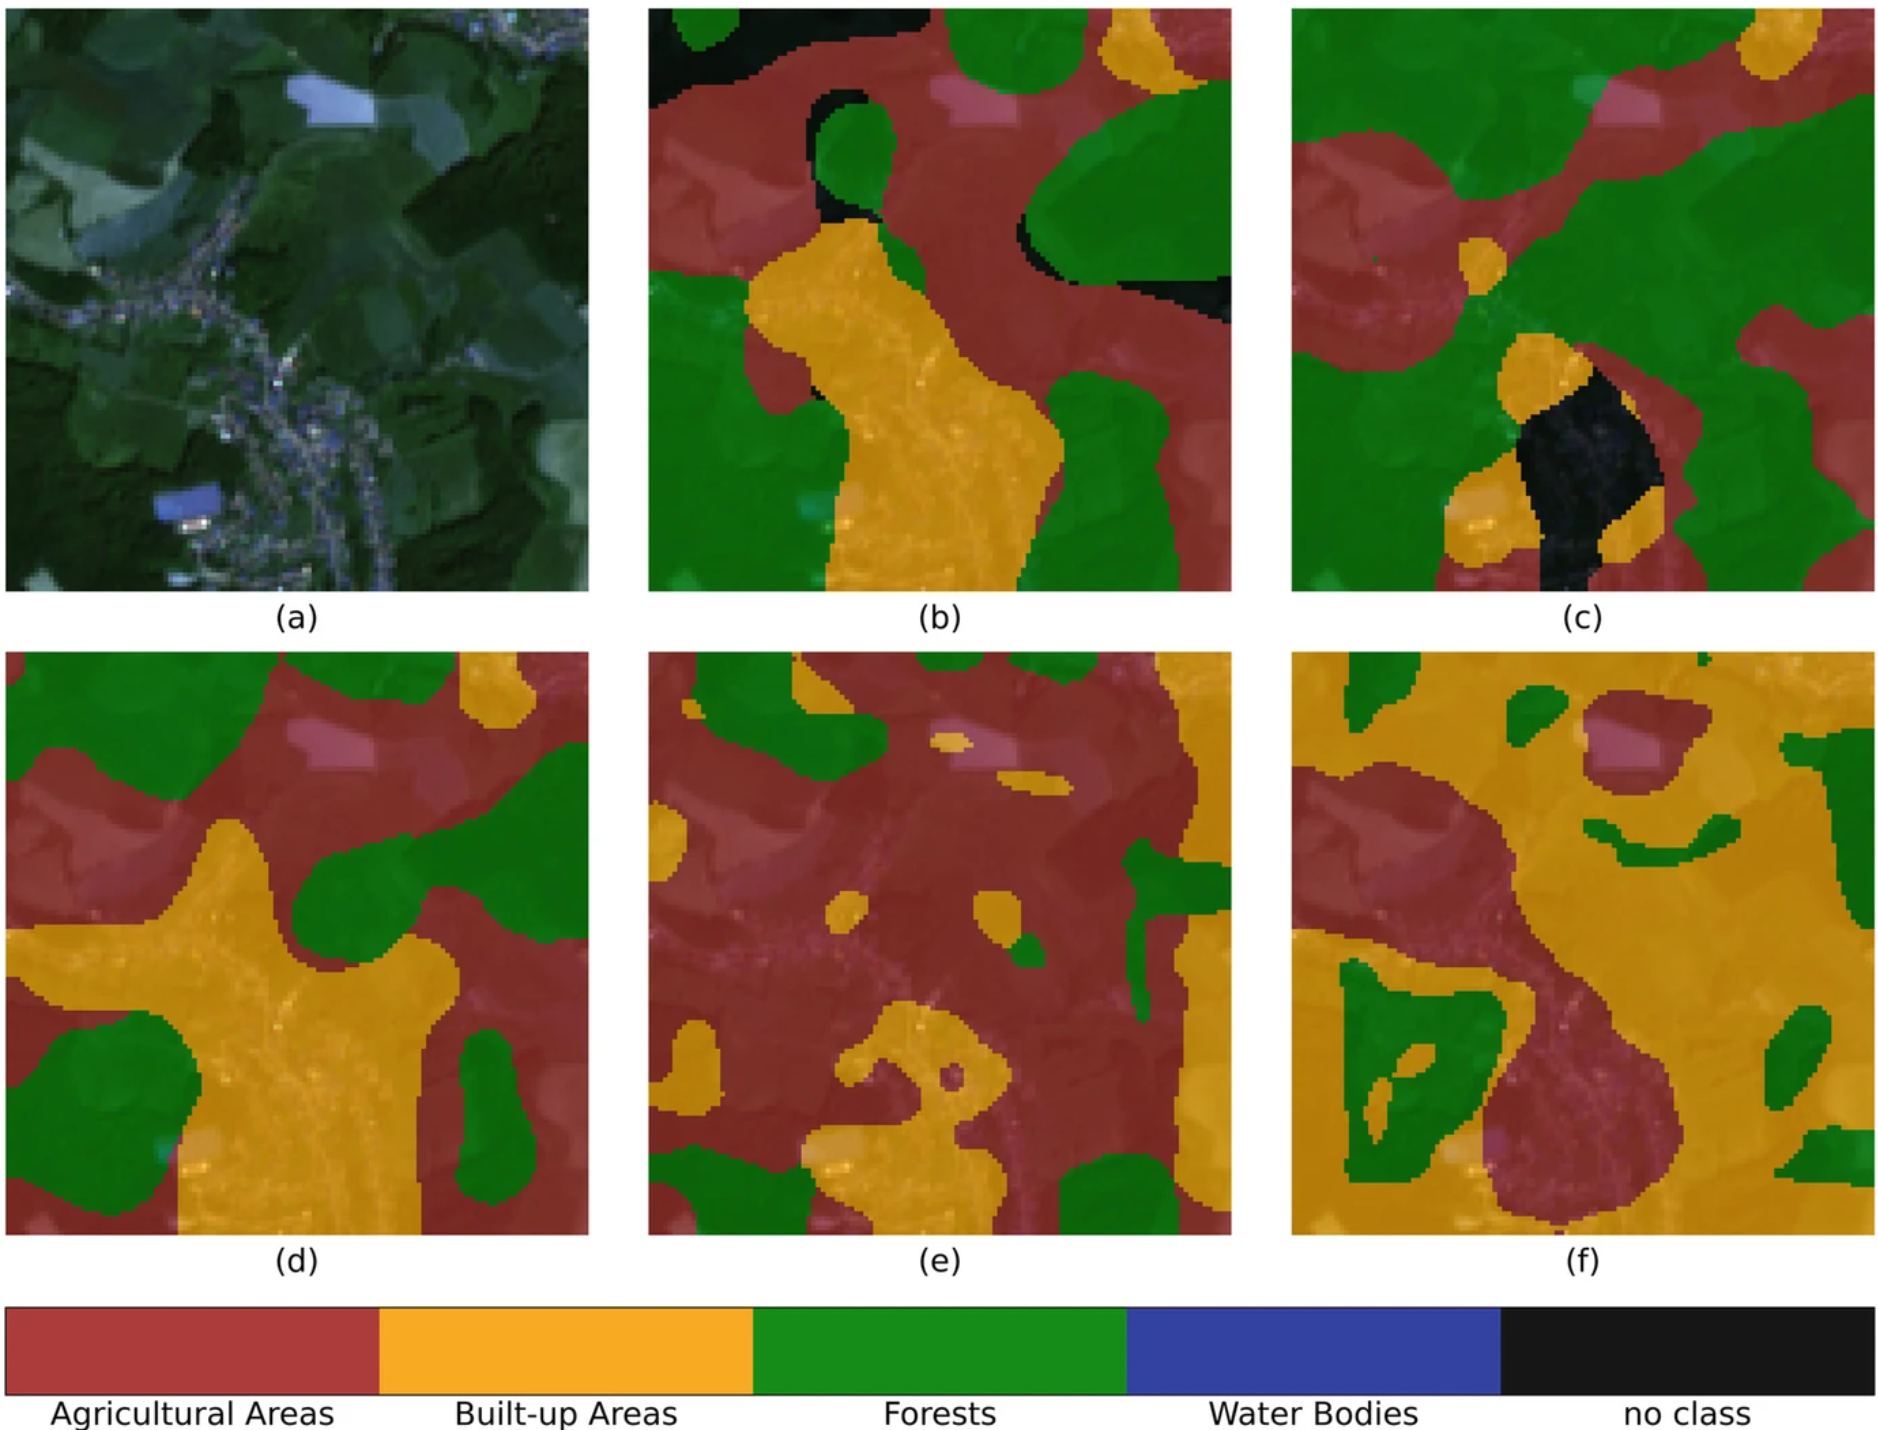
IDEAL-VGI: Analyzing and Improving the Quality and Fitness for Purpose of OpenStreetMap as Labels in Remote Sensing Applications
We are happy to announce that the IDEAL-VGI project by GIScience has been successfully completed. IDEAL-VGI was a tandem project in cooperation with Begüm Demir from the TU Berlin and was conducted under the umbrella of the VGIscience Second Phase Projects which ran from 2020 to 2022. VGIscience received funding as a Priority Programme by…
-
OEV: Indicator Correlations (4/4)
After introducing the OSM Element Vectorisation Tool last week, we now want to show possible use cases and specific examples of what the tool can do. This third and last example will look at the correlations between indicators. The goal is to first assure that the indicators measure distinct data attributes and then search for interesting or…
-
OEV: Quantifying differences between imports (3/4)
After introducing the OSM Element Vectorisation Tool last week, we now want to show possible use cases and specific examples of what the tool can do. This second of three use cases (see use case 1) compares the data in the regions of Maribor, Slovenia and Ngaoundéré, Cameroon. Both regions are exceptionally well covered with land-use and land-cover information in OSM.…
-
OEV: Analysing attributes of remarkable elements (2/4)
After introducing the OSM Element Vectorisation Tool earlier this week, we now want to show possible use cases and specific examples of what the tool can do. This first of three use cases takes a closer look at the data in the region of Heidelberg, Germany. We will use the concept of archetypes to identify…
-
OSM Element Vectorisation Tool Version 1
The IDEAL-VGI research project is nearing its end. And while that won’t be the end of our research into social data sources, data quality analyses and land-use information, we are happy to announce a major outcome: the version 1 release of the OSM Element Vectorisation Tool (OEV). The tool was first presented to the public…