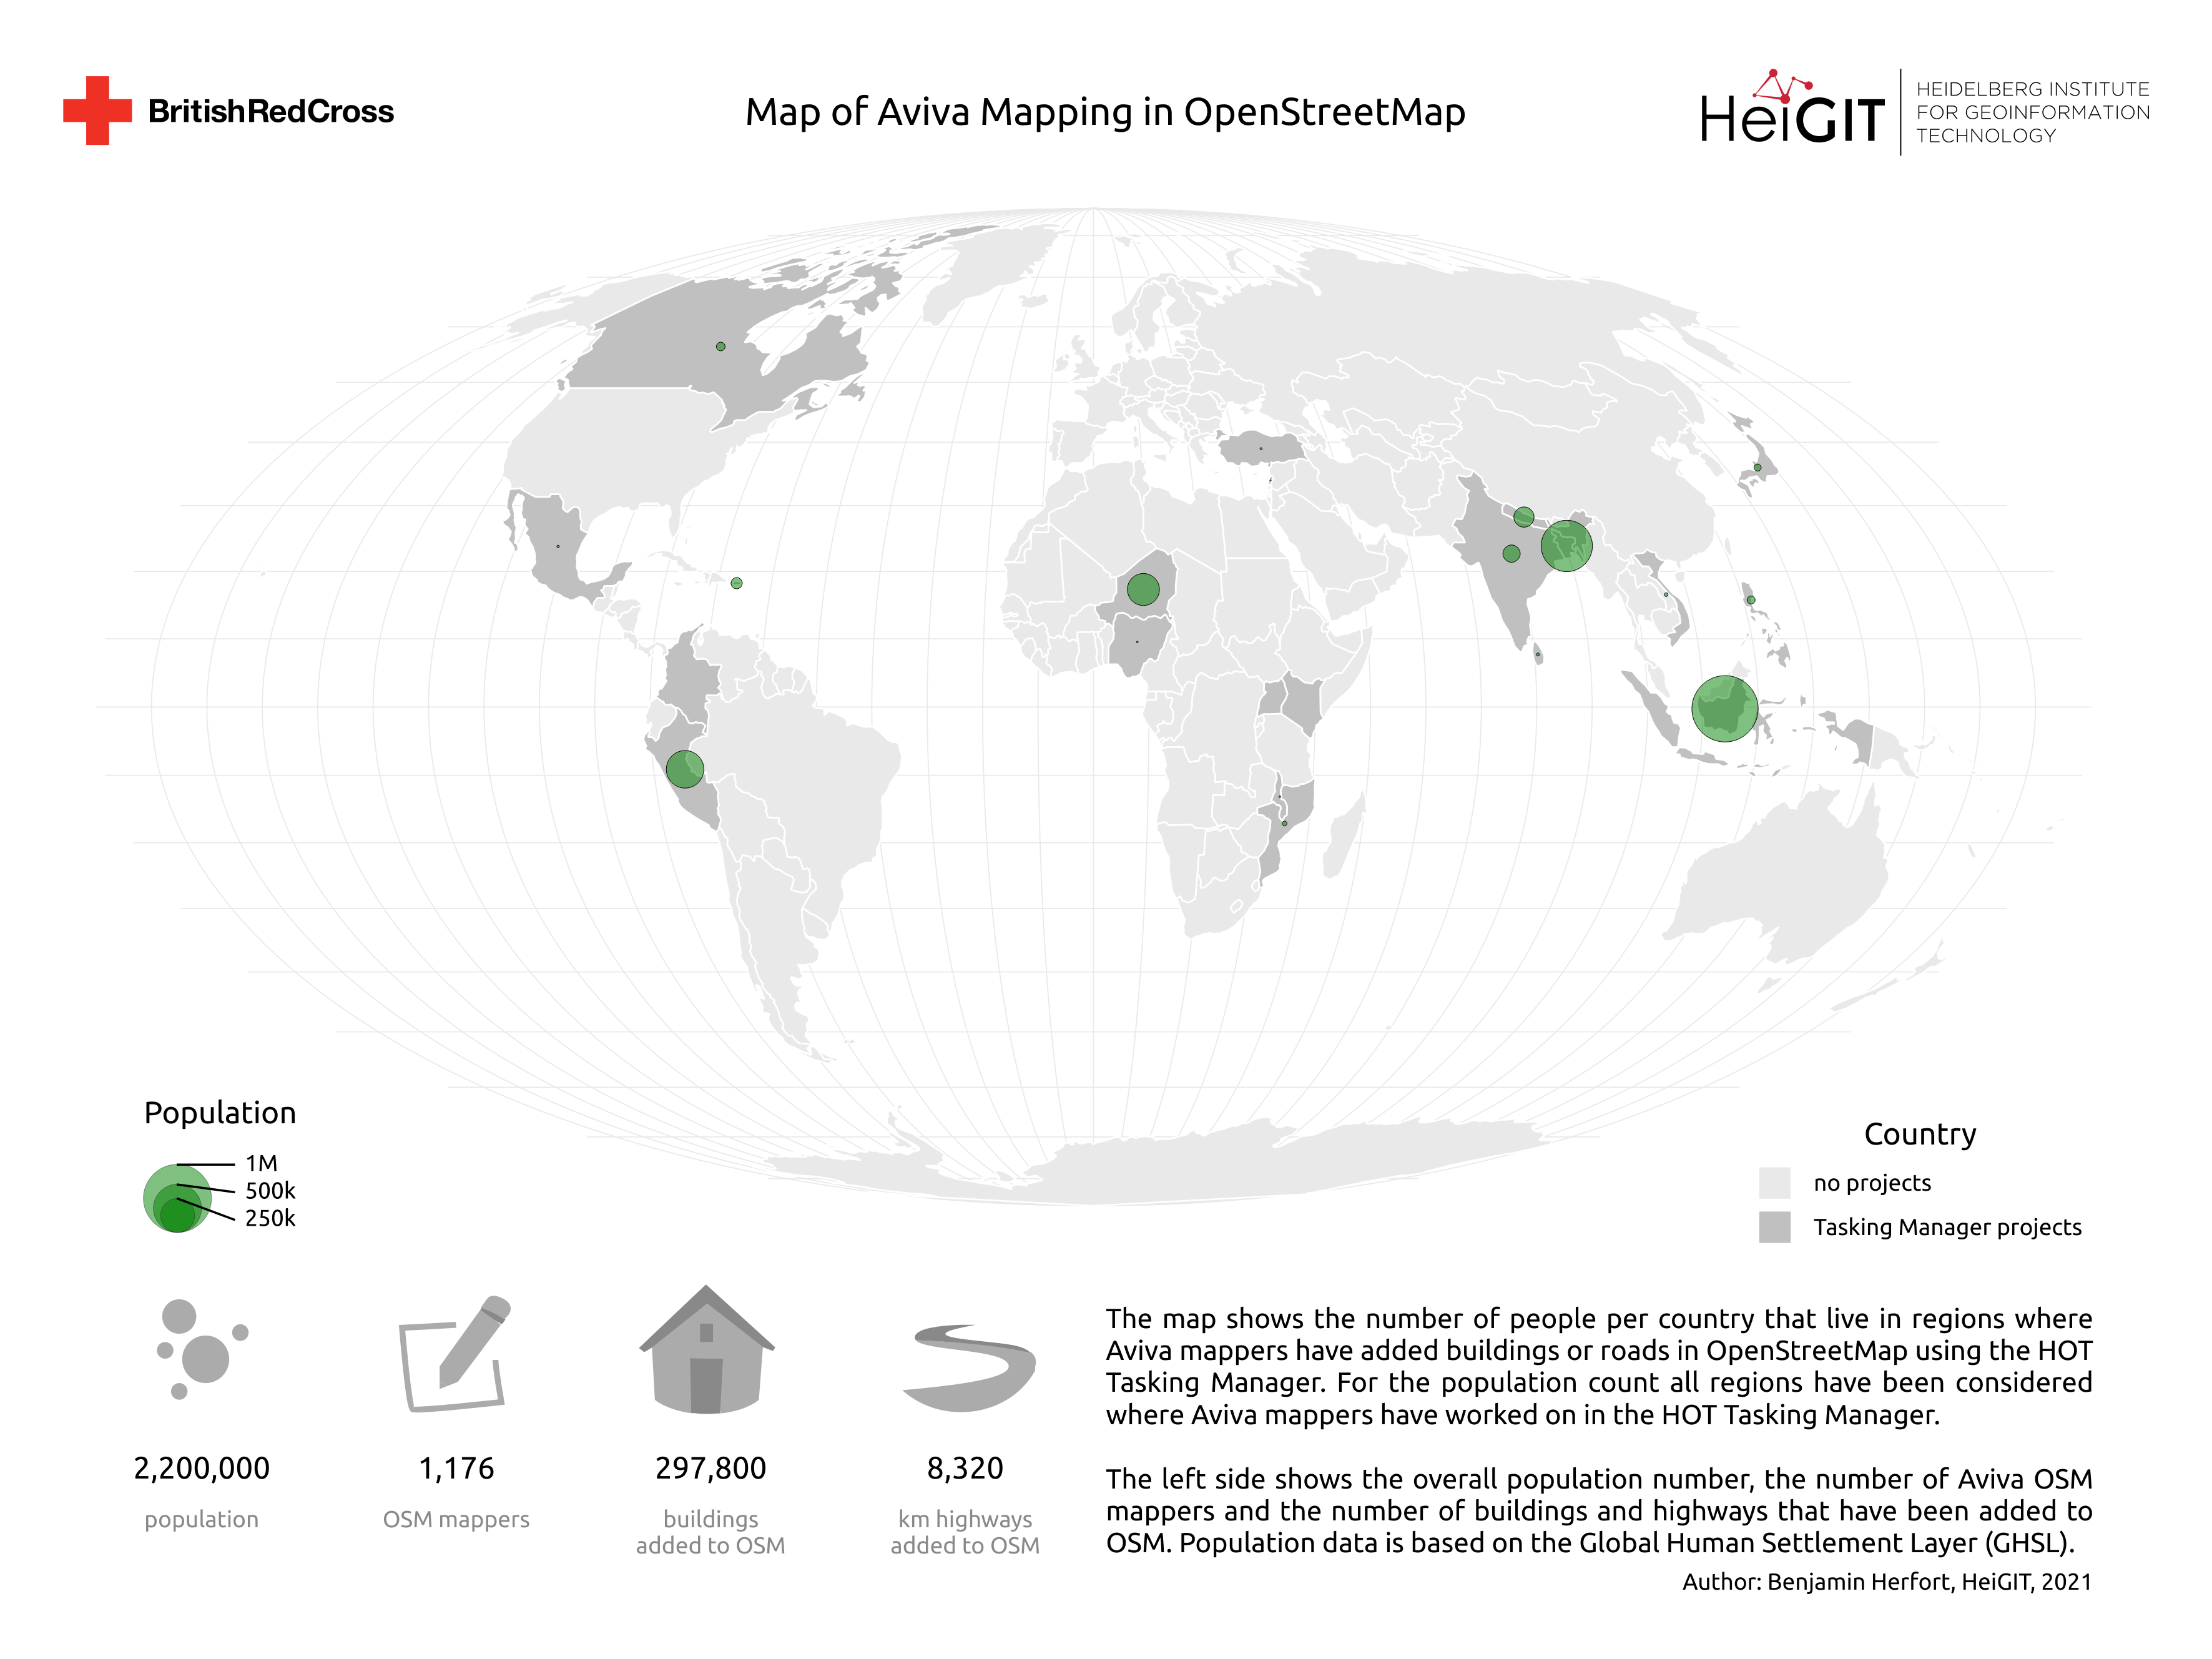
In this blog post we want to take a closer look at a fruitful mapping collaboration between humanitarian organizations and corporations. Since 2015 mapping remote areas in OSM is one part in the cooperation between the leading savings, retirement and insurance company, Aviva, and the British Red Cross (BRC). By combining multiple datasets we analyzed and reconstructed the influence Aviva mappers had on humanitarian mapping in OSM. For doing so we created a simple and slim workflow to monitor OSM mapping contributions by corporations (or other groups of mappers) based on OSM change set comments. With an analysis like this we can trace back and calculate how many features (e.g. buildings or roads) have been mapped in OSM and how many people live in the mapped regions.
This work builds upon our “Humanitarian OSM Stats” tool and website. It combines data from the open-source Tasking Manager (TM4) hosted by the Humanitarian OpenStreetMap Team (HOT) and information from OpenStreetMap (OSM) that has been processed using the ohsome OSM History Data Analytics Platform developed by HeiGIT.
If you are interested in similar topics or feel free to reach out to us (benjamin.herfort@heigit.org). We can try to cover your questions in a future post or analysis.
Results & Conclusion
The results show, that Aviva mappers have added more than 297,800 buildings and 8,320 km of roads to OSM over a time span over 5 years since 2015. In total over a thousand individual people (more than 3% of the total number of employees) have contributed to OSM. The focus of Aviva’s mapping activities, was predominantly on regions in the Global South, including projects in Middle and South America, South and South-East Asia, and Sub-Saharan Africa.
Depending on which filters are applied, we have calculated the following three population numbers:
- Aviva mappers added information on buildings or roads to OSM for a region which is home to more than 2.2 Million people.
- Aviva mappers completely mapped buildings and roads in OSM for a region which is home to more than 830,000 people.
- Aviva mappers completely mapped and validated buildings and roads in OSM for a region which is home to more than 18,000 people.
Since most tasks which Aviva mappers worked got “mapped” and “validated” in the end (sometimes by non-Aviva mappers), we assume that in this case the first option without any further filters, covers the impact of Aviva mappers most accurately and was used in our final representation of results.
Methods:
Organizations that are using the HOT Tasking Manager have the option to define change set comments during project set up. This allows us to trace back and identify the individual change sets belonging to a certain group of mappers that use the same change set comment (e.g. “Aviva” for mappers that belong to Aviva). To find these, we were using the OSM change set dump, which we parsed into a PostGIS Database with ChangesetMD. We then extracted the information about the individual change sets, including the unique change set-ID, the spatial extent and timestamp of the contribution.
To calculate the amount of mapped buildings and the length of the added highway features, we made use of our OpenStreetMap History Database – OSHDB. The OSHDB is a high-performance data analysis framework, which enables us to analyze the full OSM history data. Through its contribution view, and by matching the changeset-IDs with the individual contribution, we could determine the payload for each contribution.
In the final step we derived the population count for the affected areas. Therefore we matched the change set with the corresponding task squares in the HOT Tasking Manager and used these in combination with the Global Human Settlement Population layer. For our analysis we’ve calculated the population number using every HOT Tasking Manager task (a) or used additional filters.
One filter option is to only use the tasks, which got marked as “mapped” by an Aviva mapper (b). Another option is to only consider tasks which have been “validated” by an Aviva mapper (c). Since both filters reduce the amount of tasks, they produce a lower population number. For instance, for filter (c) the population number would not include any task that got “mapped” by Aviva mappers, but “validated” by someone else.
The following flowchart displays a detailed summary of our workflow.You can also check the humstats website for more information on the terminology.
Selected Related Publications
Herfort, B., Lautenbach, S., Porto de Albuquerque, J., Anderson, J., Zipf, A.The evolution of humanitarian mapping within the OpenStreetMap community. Scientific Reports 11, 3037 (2021). DOI: 10.1038/s41598-021-82404-z https://www.nature.com/articles/s41598-021-82404-z
Grinberger, A.Y., Schott, M., Raifer, M., Zipf, A. (2021): An analysis of the spatial and temporal distribution of large‐scale data production events in OpenStreetMap. Transactions in GIS. 2021; 00: 1– 20.
https://doi.org/10.1111/tgis.12746
Schott, M., Grinberger, A.Y., Lautenbach, S., Zipf, A. (2021): The Impact of Community Happenings in OpenStreetMap — Establishing a Framework for Online Community Member Activity Analyses. ISPRS Int. J. Geo-Inf. 2021, 10, 164. https://doi.org/10.3390/ijgi10030164
Raifer, Martin; Troilo, Rafael; Kowatsch, Fabian; Auer, Michael; Loos, Lukas; Marx, Sabrina; Przybill, Katharina; Fendrich, Sascha; Mocnik, Franz-Benjamin; Zipf, Alexander (2019): OSHDB: a framework for spatio-temporal analysis of OpenStreetMap history data. Open Geospatial Data, Software and Standards.
Auer, M.; Eckle, M.; Fendrich, S.; Griesbaum, L.; Kowatsch, F.; Marx, S.; Raifer, M.; Schott, M.; Troilo, R.; Zipf, A. (2018): Towards Using the Potential of OpenStreetMap History for Disaster Activation Monitoring. ISCRAM 2018. Rochester. NY. US.
Scholz, S., Knight, P., Eckle, M., Marx, S., Zipf, A. (2018): Volunteered Geographic Information for Disaster Risk Reduction: The Missing Maps Approach and Its Potential within the Red Cross and Red Crescent Movement. Remote Sens., 10(8), 1239, doi:10.3390/rs10081239.


