Hello and welcome back to the ohsome Region of the Month-blog post series where you can read about potential use cases of the ohsome API and maybe even get inspired to send some requests of your own. If you are new to the series you should definitely take a look at former blog posts, for example our last one on the length of coastlines or this one which is about forest-tags too and was done in a jupyter notebook. This weeks blogpost looks at different “tree-related” tags in OpenStreetMap and their development in different countries over time (2008-2021). The tags of interest are “natural=wood“, “landuse=forest” and “landcover=trees“. Let’s begin!
Data
For sending requests to the ohsome API you need input boundaries first, be it a GeoJSON (bpolys) or the coordinates of a region of interest (bboxes). As usual, we sent a “bpolys-request” and got our data from osm-boundaries. For convenience, you can find a GeoJSON-file with all the boundary data used in this analysis in a snippet here as well as the requests sent themselves.
Requests
Since there was a need for more than one filter-condition, several requests were sent. The conditions used are listed below:
- filter1 = geometry:polygon and natural=wood
- filter2 = geometry:polygon and landuse=forest
- filter3 = geometry:polygon and landcover=trees
- time = 2008-01-01/2021-07-01/P1M
Data exploration
First of all, one can observe that different tags dominate in each region and furthermore it is important to note that according to the OpenStreetMap wiki “landuse=forest” is often times used for maintained forest areas, but some mappers use it on any woodland so there is no clear definition. On the other hand there is the “natural=wood“-tag which is usually used for forests with limited to no forestry management so in these regions there might either be a certain form of landuse dominating or the tagging behaviours are locally different from each other. The third tag looked at in this analysis is “landcover=trees” which describes an area physically covered by trees independently of the degree of human involvement. Unfortunately, we could only find information on imports and tagging conventions for Canada and Japanbut based on those one can assume that for Canada, “natural=wood” would be the dominating tag, and that for Japan “natural=wood” and “landuse=forest” display low/no and high maintenance woodlands as described earlier. For all the countries looked at within the analysis the “landcover=trees“-tag has occurred at some point but only in few countries the use of it increased considerably, so it seems there might be a development in some countries while others focus on the other two tags.
Below you can see several graphics displaying the development of tree-related tags between 2008 and 2021
When looking at Finland, there is a first strong increase of the “natural=wood“-tag between March and May 2011, however since then there has been a an increasing trend in area with a subsequent stagnation and a light decrease beginning in the second half of 2020. The “landuse=forest“-tag on the other hand starts with only slowly rising values until the time span between May and October 2019 when there is a strong jump in numbers. Ever since “landuse=forest” held the highest object-numbers for Finland. The “landcover=trees“-tag occurred first in December 2012 and increased until today yet in much lower manner (see additional graphic in the snippet).
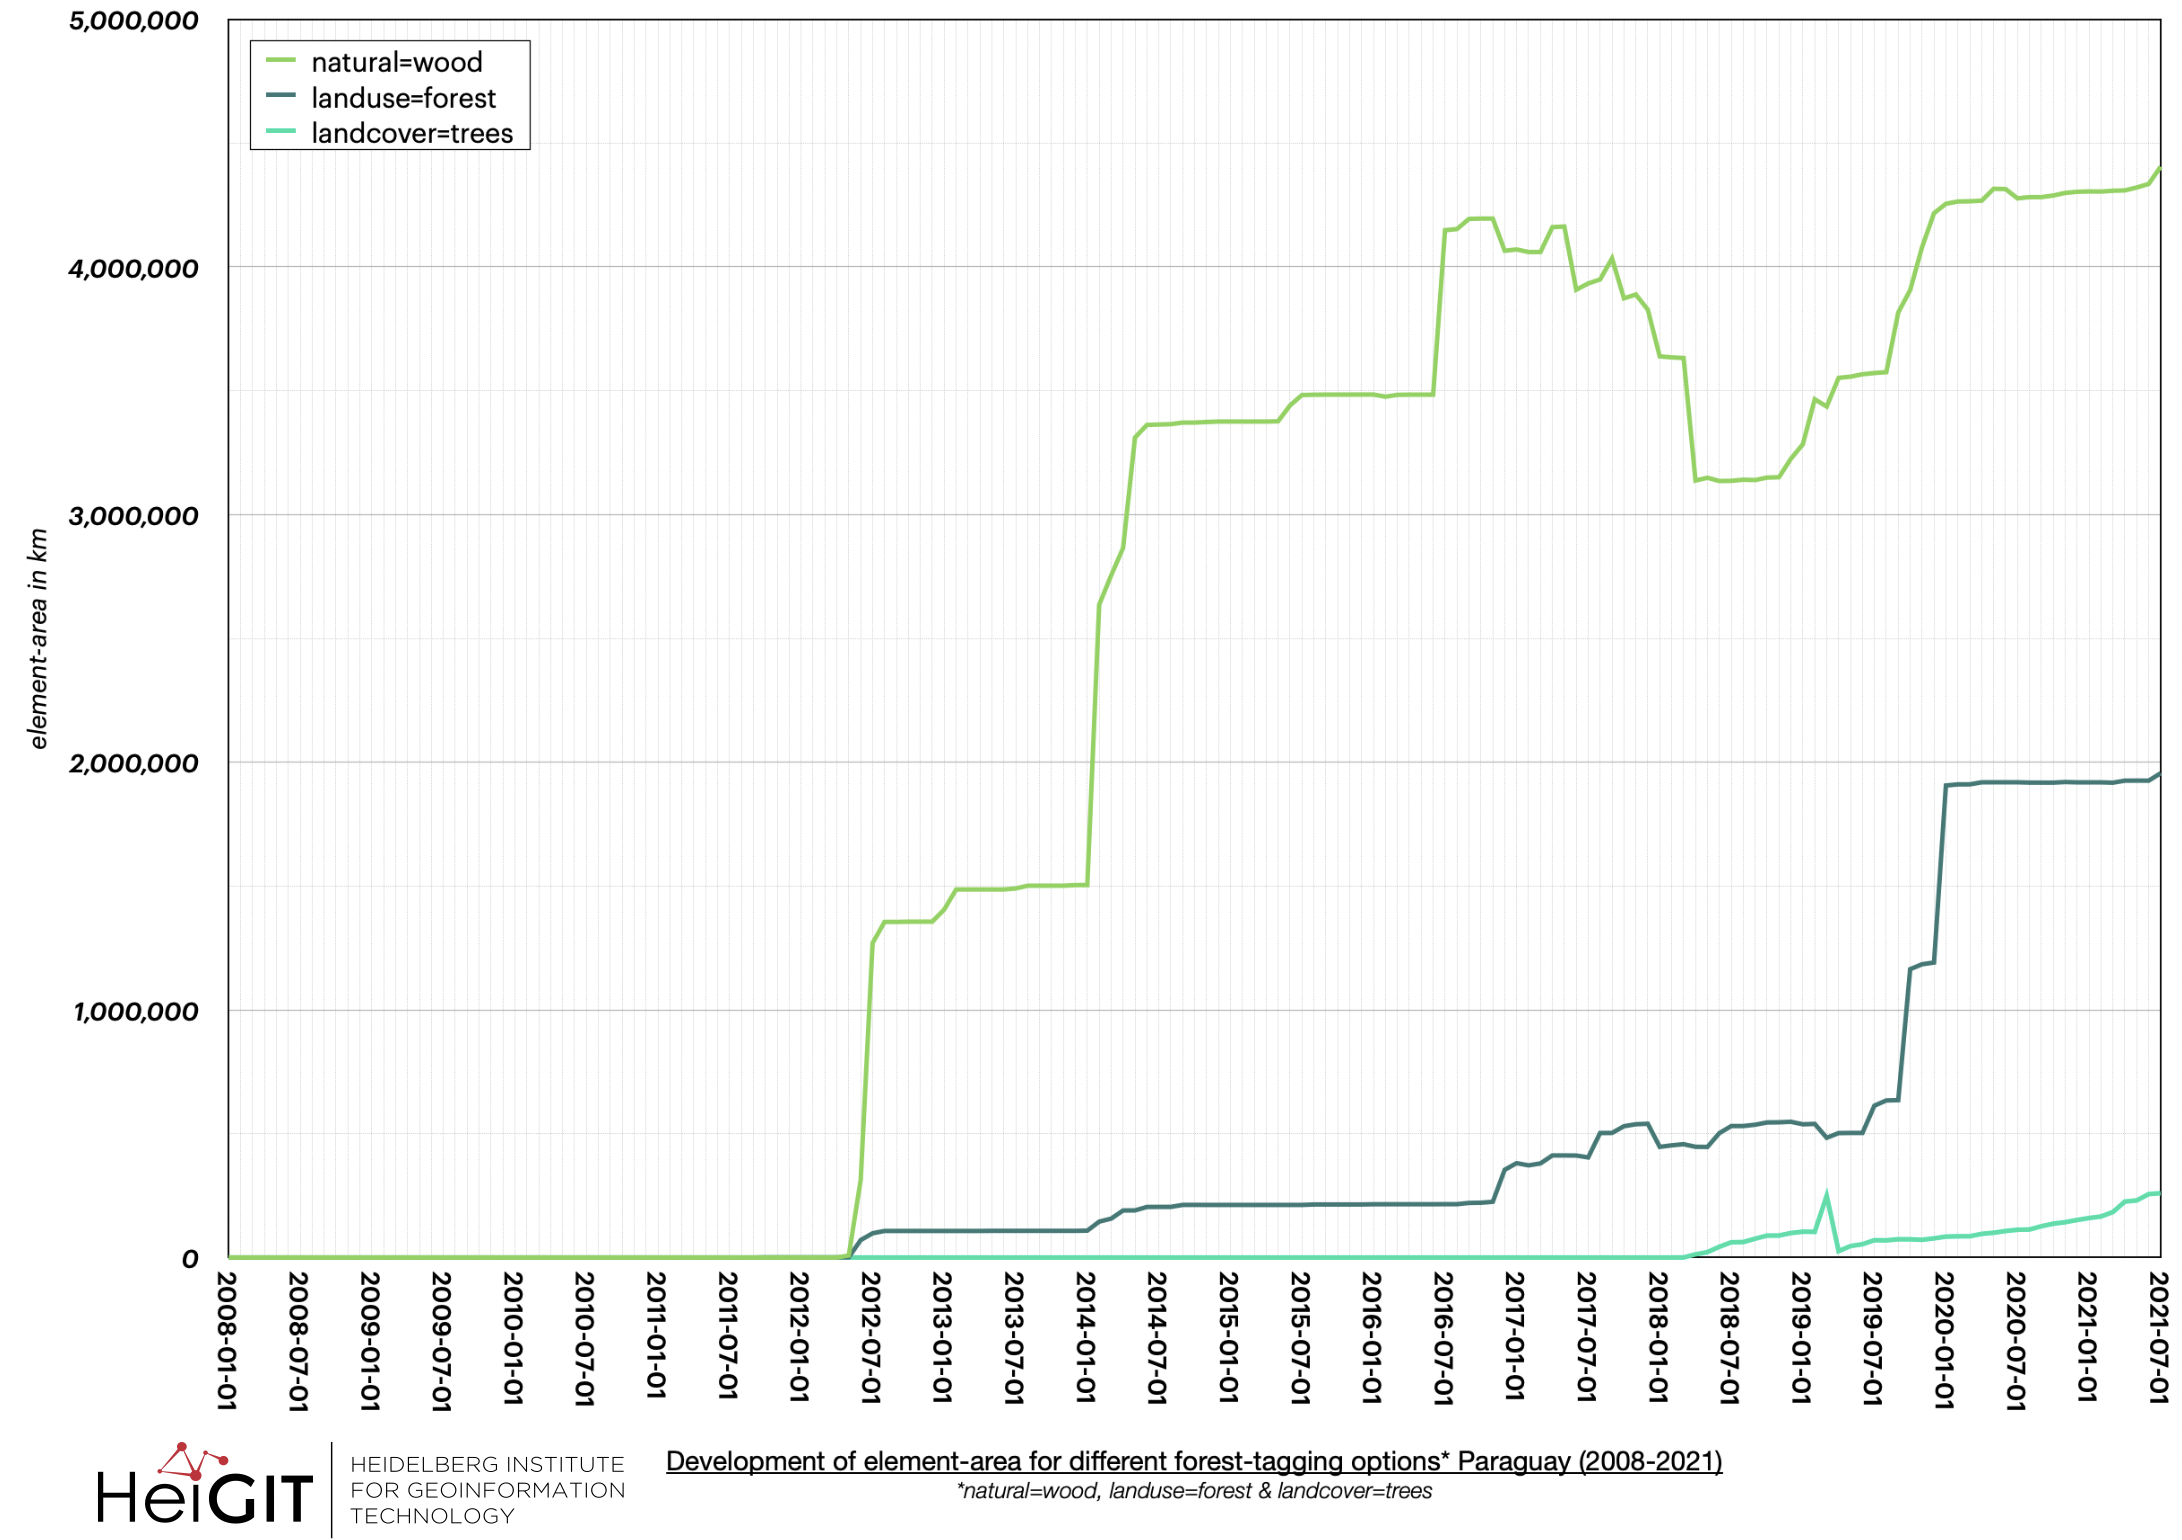
Within Paraguay, “natural=wood” emerges as the dominant tag, but with a rather changeable trend, as there are always phases of alternating increase and stagnation, as well as a decline in values between May 2017 and December 2019. In contrast, “landuse=forest” shows an increase without collapses, but with area values at a considerably lower level. In addition, a data jump occurs between September 2019 and January 2020. The “landcover=trees” day proves to be the day with the lowest values and reaches its maximum in March 2019 and records a strong decrease in the following month. As a result, values start to rise again.
For Canada the dominating tag is, as was expected, “natural=wood” with notably strong increases during the first half of 2017 followed by a minor but notable collapse. Since then the rise was more moderate. The other two tags show much lower values, but “landuse=forest” is still higher in numbers than “landcover=trees“. The main jump in data is between February and May 2018 and again between December 2019 and March 2020. The “landcover=trees“-tag doesn’t occur until December 2015 and the tag is seldom used.
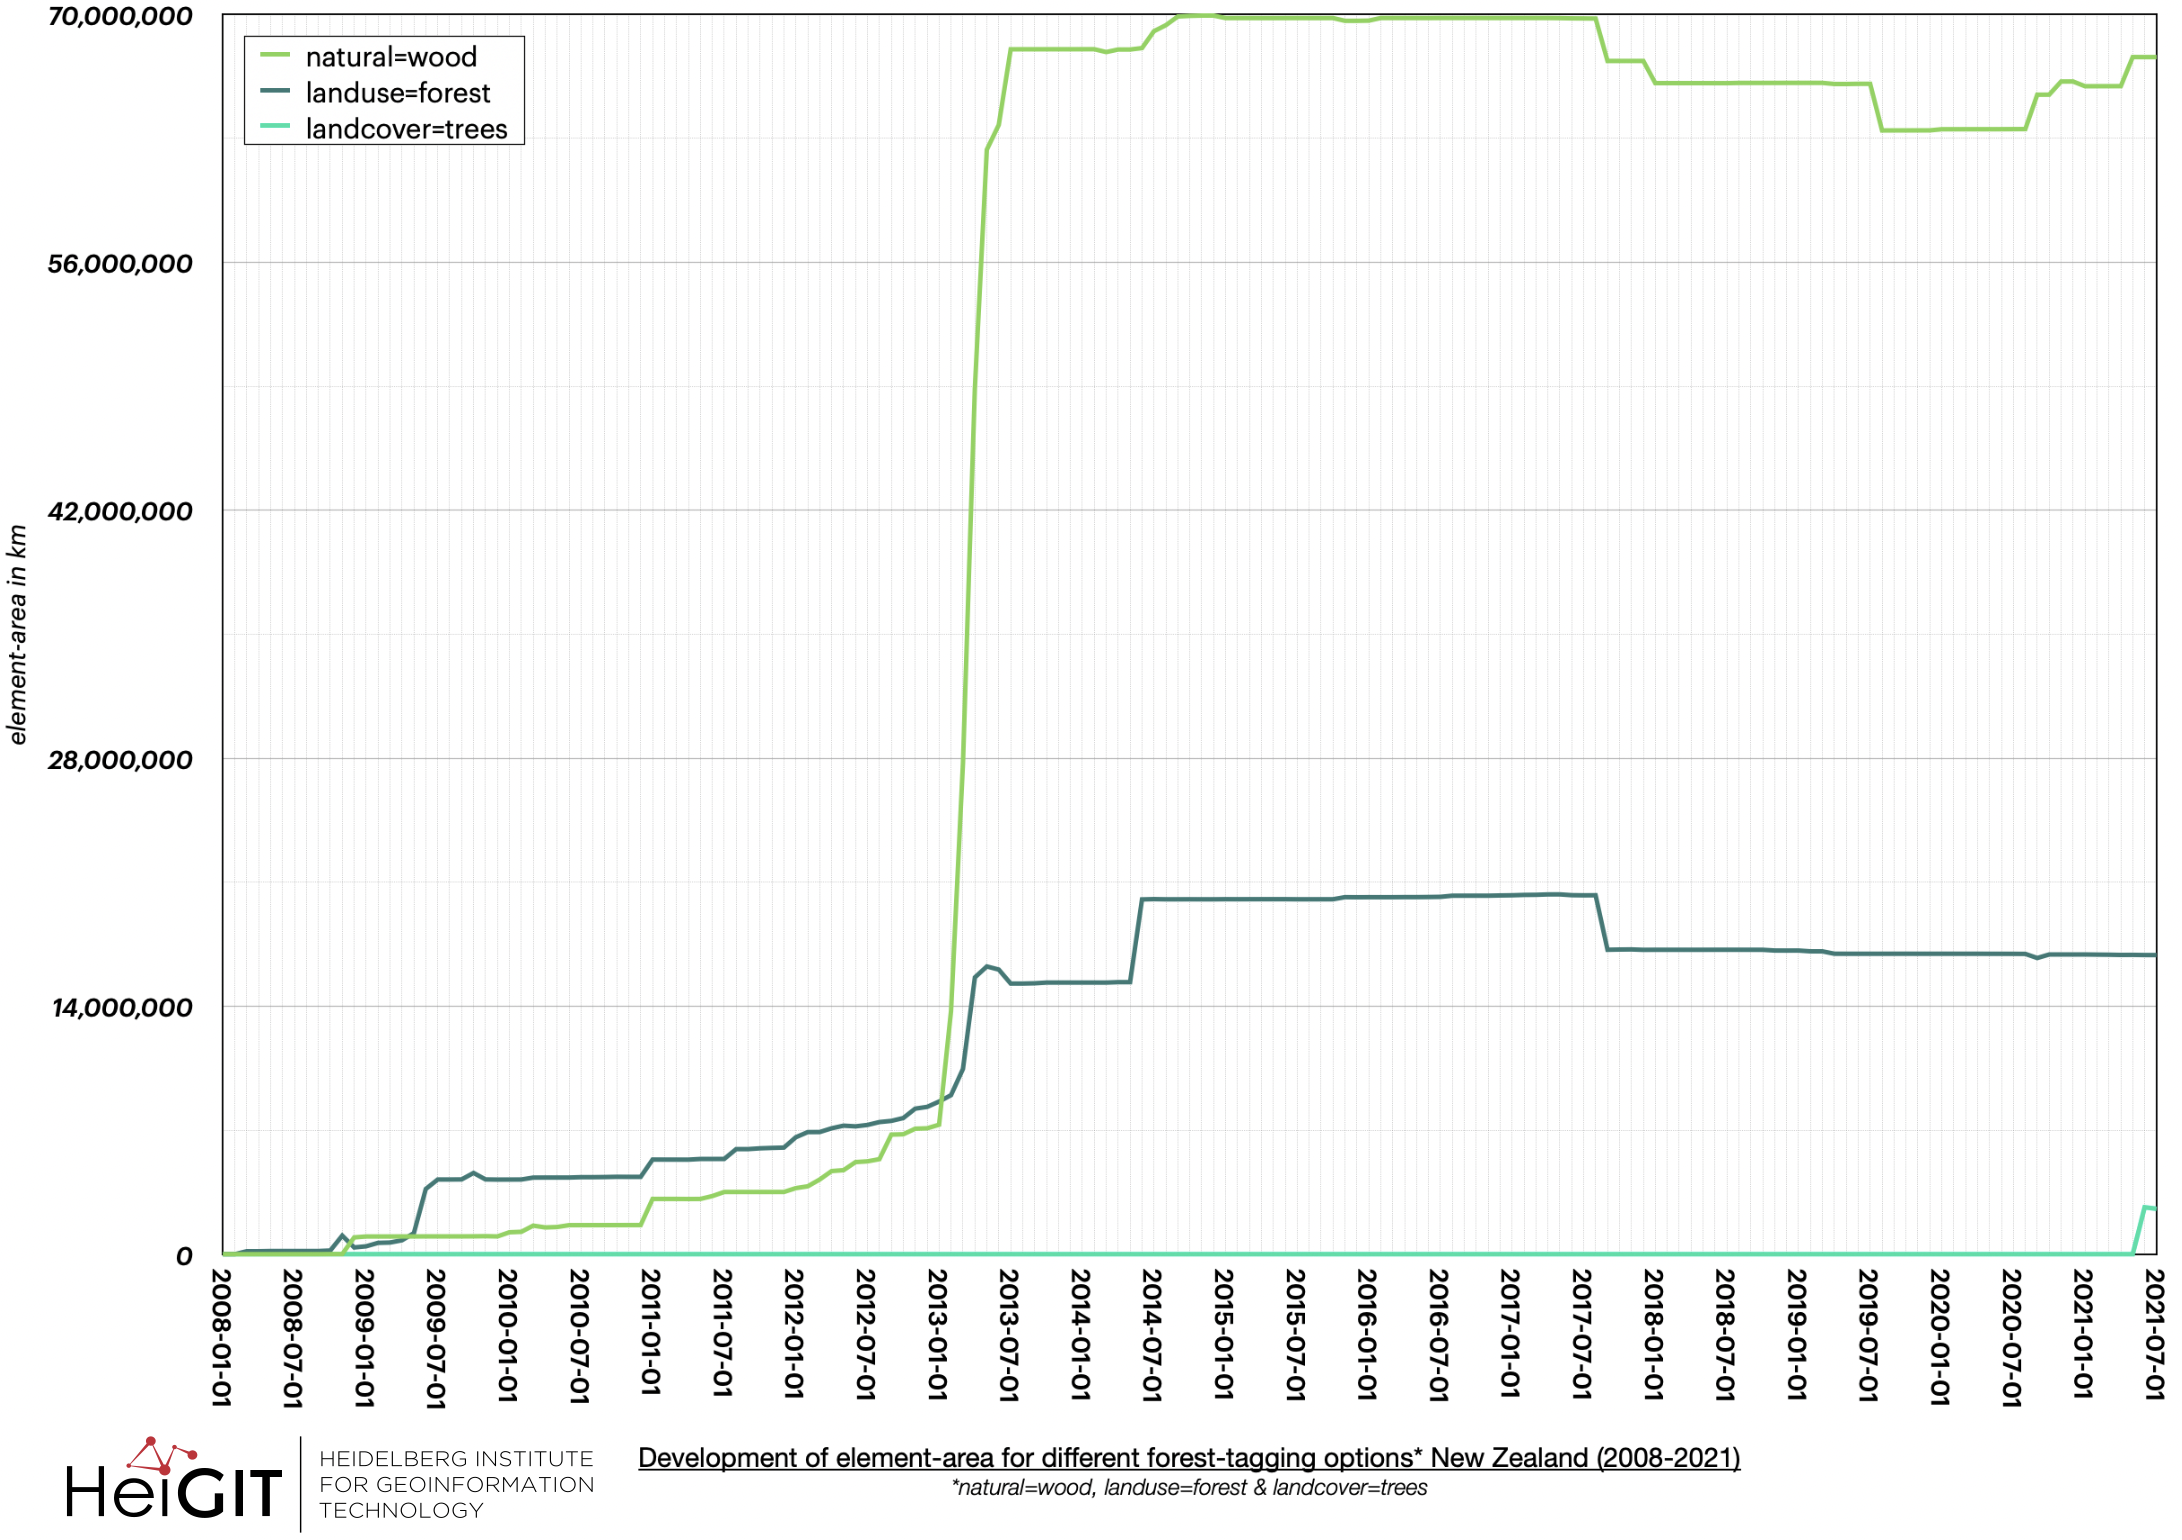
New Zealand barely uses the “landcover=trees“-tag, which only occurred in December 2019, yet there is a notable increase of it since May 2021. The tag “natural=wood” dominates and displays a strong rise in values from January to July 2013 after which it stays more or less on the same level with a minor decline in the values between July 2019 and September 2020. It is similar with “landuse=forest” although in this case a strong increase only takes place between March and July 2013 and again between May and June 2014. Subsequent to that these values too stay on about the same level.
For Morocco, “natural=wood” initially turns out to be the most represented tag. This was the case until October 2012 and since then the tag “landuse=forest” has been at the top. The values for “landcover=trees” are generally quite low in this case as well, however towards the end of the period under consideration there is an increase to the previous maximum value, which was reached from August 18.
Looking at the tag development for the area of Italy, “landuse=forest” is the most represented and shows a quite strong increase right at the beginning until May 2008. Subsequently, the trend flattens out until about January 2010. At this point, a phase of high increase of the area begins until September 2012. After this, the trend flattens out again. The tag “natural=wood” shows a more or less steady and moderate trend until October 2014. Since then, the values have tended to stagnate. The last tag “landcover=trees” has been more strongly represented since February 2011, but, as in all cases, is relatively poorly represented. Since June 2013, no major in- or decreases have been recorded here.
At last, for Japan “natural=wood” shows by far the highest count values as well as a strong increase between March 2010 and January 2011, when they peaked too. Regarding the information on tagging conventions we were able to find and under the premise that everything was tagged according to them of course, it appears that in Japan most (tagged) woodland is low to no maintenance area. Current values are getting a little closer to this maximum after declining subsequent to the peak. The “landuse=forest“-tag does not display any notable increases after January 2011 and values are beginning to slightly decrease by January 2019. The first occurrence of “landcover=trees” is in January 2017 but in comparison to the other tags the values are quiet low.
Finally, it can be summarised that “landcover=trees” has only very low values in all cases, whereas Paraguay and Italy in particular can show comparatively high values when considered individually. Moreover, it should not go unmentioned that “landcover=forest” and “natural=wood” alternate as the dominant tag depending on the region considered. In many cases, Italy being the exception, however, “natural=wood” is usually more strongly represented at first and is only surpassed by “landuse=forest” later in the course.
Thanks for reading this ohsome Region of the Month blogpost, we hope you liked it. Stay tuned for more content from this series in the future!
Background info: the aim of the ohsome OpenStreetMap History Data Analytics Platform is to make OpenStreetMap’s full-history data more easily accessible for various kinds of OSM data analytics tasks, such as data quality analysis, on a regional, country-wide, or global scale. The ohsome API is one of its components, providing free and easy access to some of the functionalities of the ohsome platform via HTTP requests. Some intro can be found here:
-
ohsome general idea
-
ohsome general architecture
-
how to become ohsome blog series
-
how spatial joins queries work in the OpenStreetMap History Database OSHDB


