

In his bachelor’s thesis, supervised by HeiGIT’s apl. Prof. Dr. Sven Lautenbach, Lars Reckhaus examined the suitability of OpenStreetMap (OSM) for location analyses in the context of residential real estate projects. Typically, such analyses require the use of a variety of data sources and are mostly performed manually. For this reason, they tend to be quite time-consuming. The use of OSM as the primary or sole data source has the potential to significantly reduce this effort. However, for OSM to be useful, the quality of the data needs to be sufficiently high. Therefore, the application-specific quality of OSM data has been the subject of research. The focus of the thesis lied on using OSM for so-called “POI research”, which investigates the availability of relevant infrastructure (or points of interest = POI) in the vicinity of the property.
Research design
The data quality was analyzed using an extrinsic approach, meaning that OSM was compared to a reference dataset of presumably higher quality. As no suitable high-quality dataset was available, the reference dataset was created by collecting own data.
The practical approach was divided into three steps (s. Fig. 1):
- In a first step, the eleven most important infrastructures for the residential environment were identified by means of a survey.
- Subsequently, a reference dataset of these infrastructures was created by mapping their occurrence in 24 study areas across two German regions.
- Finally, the OSM data could be checked for the two data quality parameters completeness and correctness by comparing it to the reference dataset.

Fig. 1: Practical Approach
Survey
In the survey the participants (private individuals as well as employees of real estate companies) were asked to choose from a list of possible infrastructures all those that they consider to be important for the living environment. The result (s. Tab. 1) shows the eleven most frequently mentioned infrastructures that were selected to be included in the analysis.
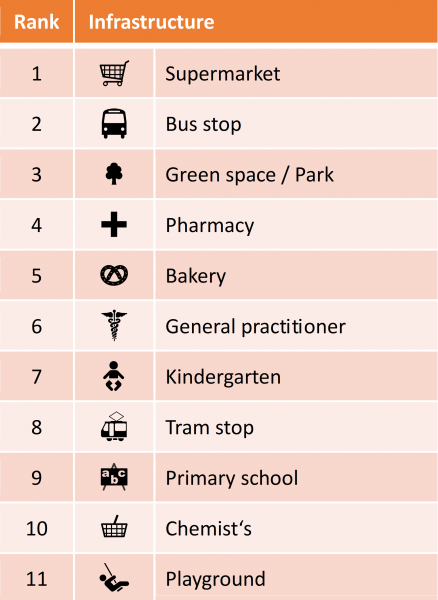
Tab. 1: Top 11 infrastructures
Study areas
In order to check for a possible urban-rural gradient in the data quality, the study areas were chosen to represent different types of settlement structures. In total four categories were defined by population and further criteria: (1) The urban structures “city” and (2) the special case “city centre” and the more rural structures (3) “small town” and (4) “village”. To further address possible regional disparities the areas were spread over two regions in Germany (s. Fig. 2 & Fig. 3).
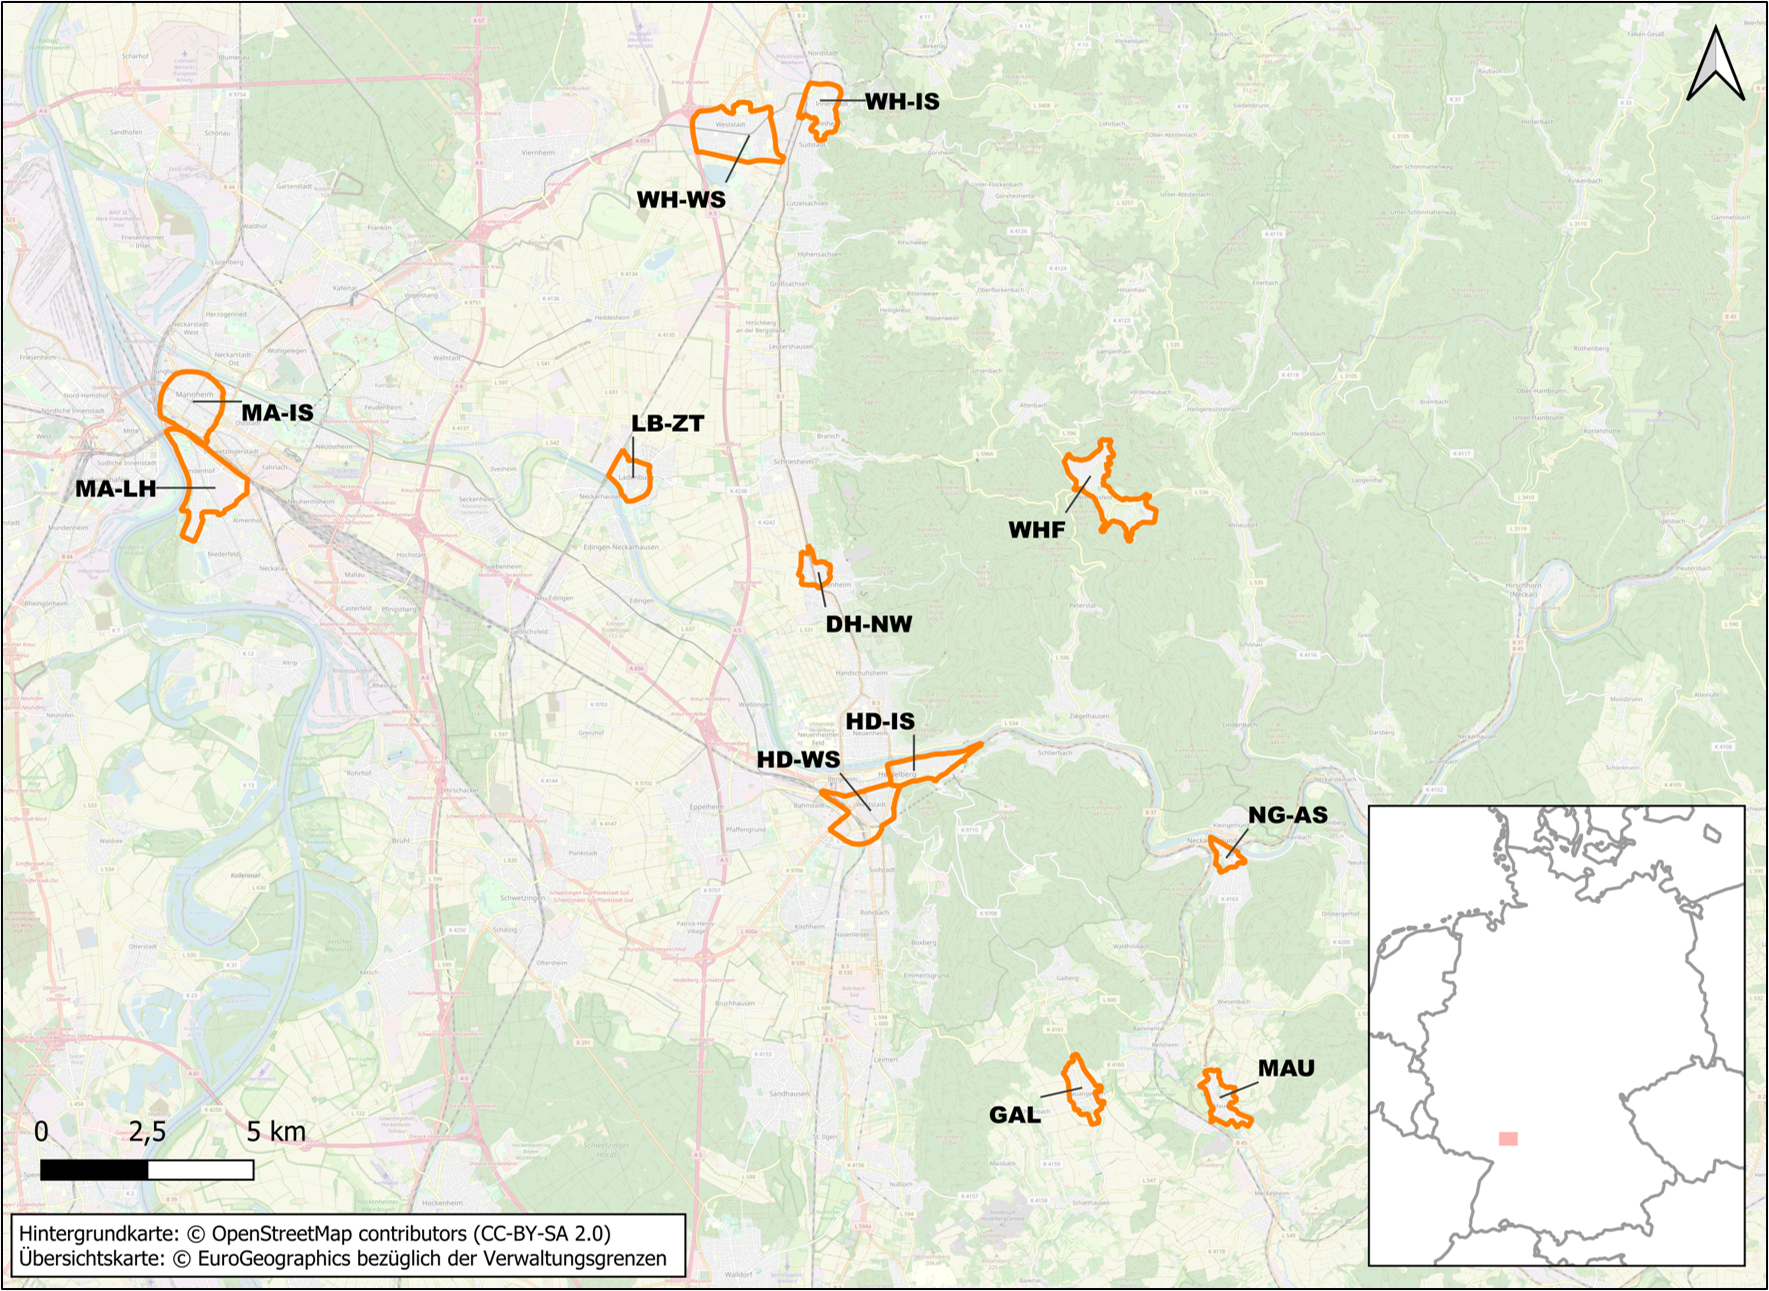
Fig. 2: Study areas in the Rhine-Neckar metropolitan area
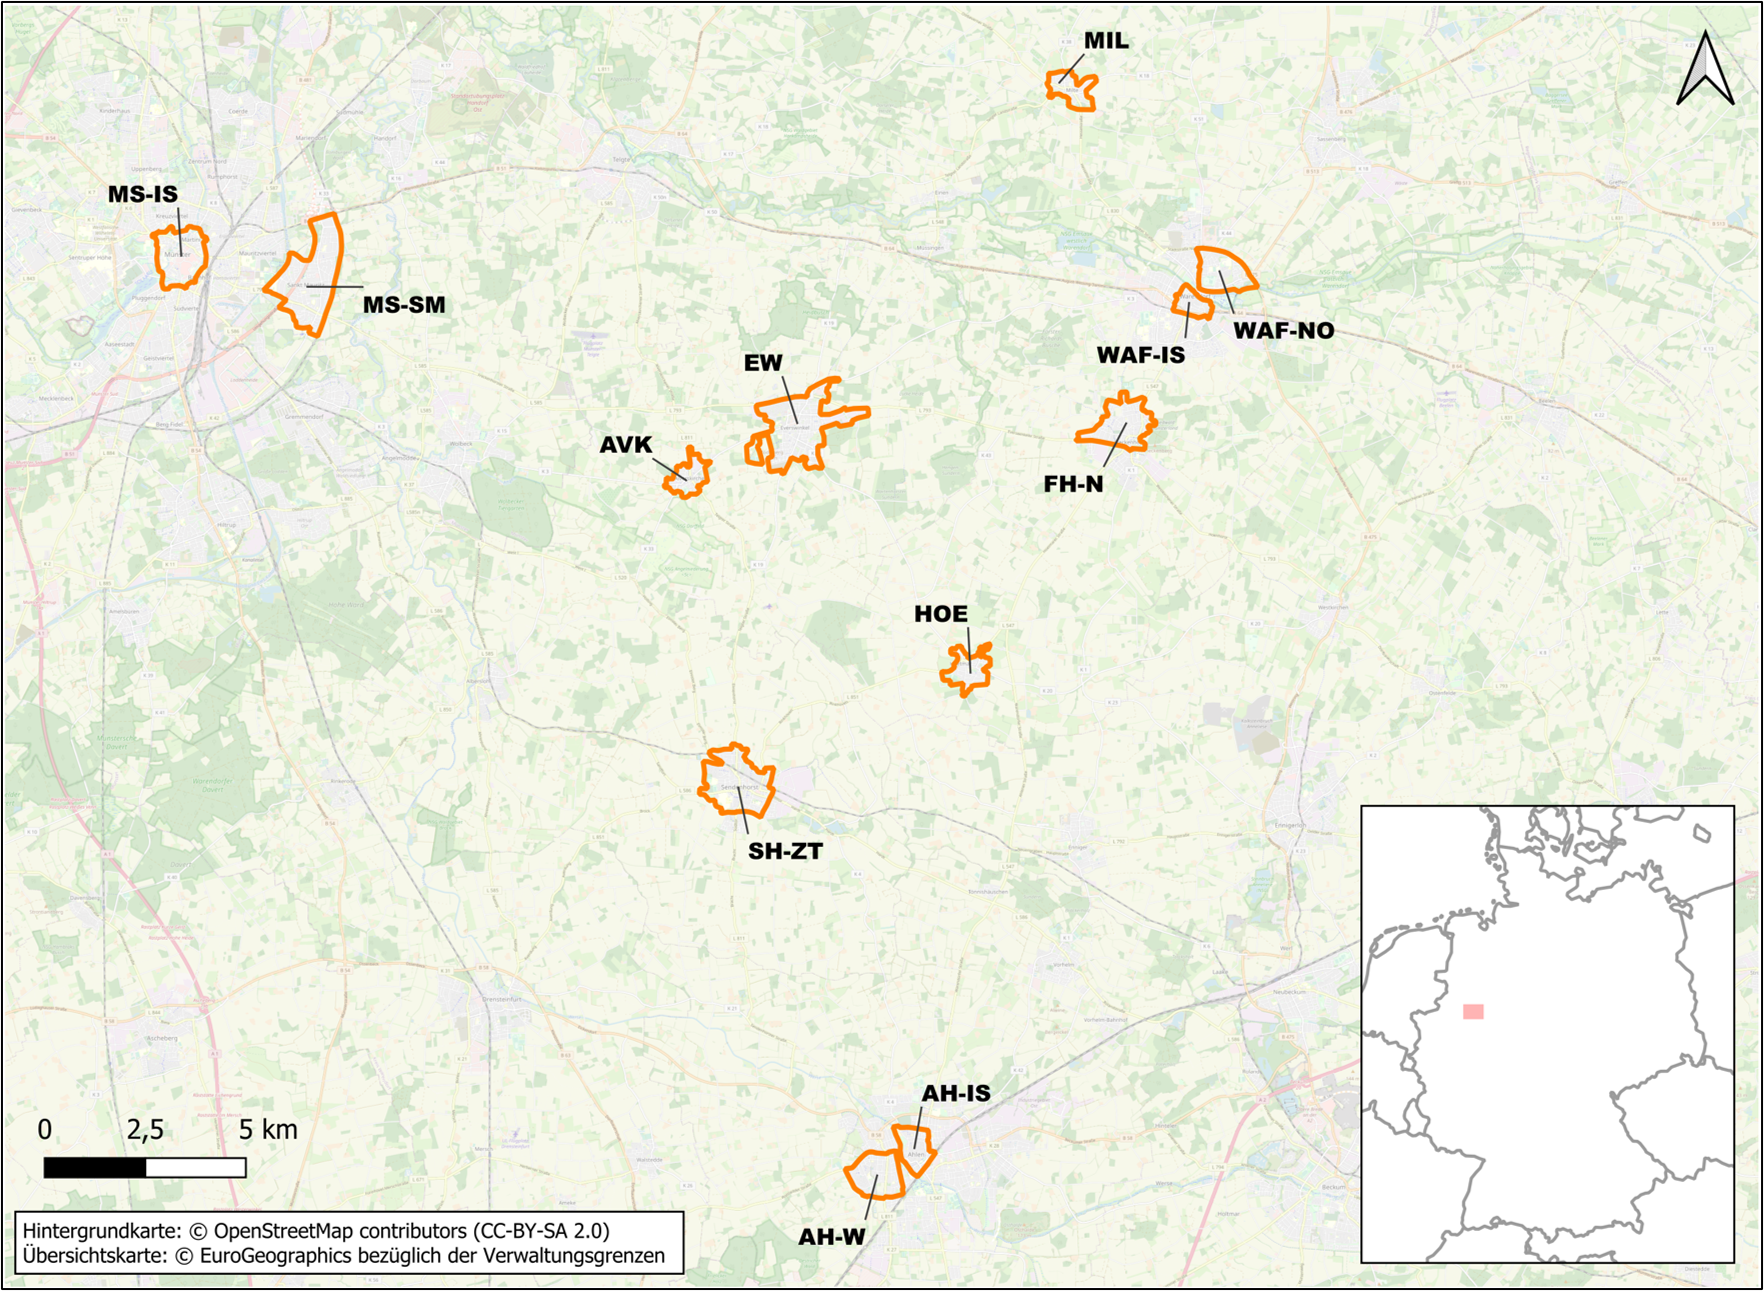
Fig. 3: Study areas in Münsterland
Data analysis
To be able to calculate the quality parameters, it was necessary to divide the objects obtained from the mapping and OSM into three classes (s. Fig. 4):
- True positives (TP) are OSM objects that also exist in reality.
- False positives (FP) are OSM objects that don’t exist in reality.
- False negatives (FN) are existing real world objects that are not contained in OSM.
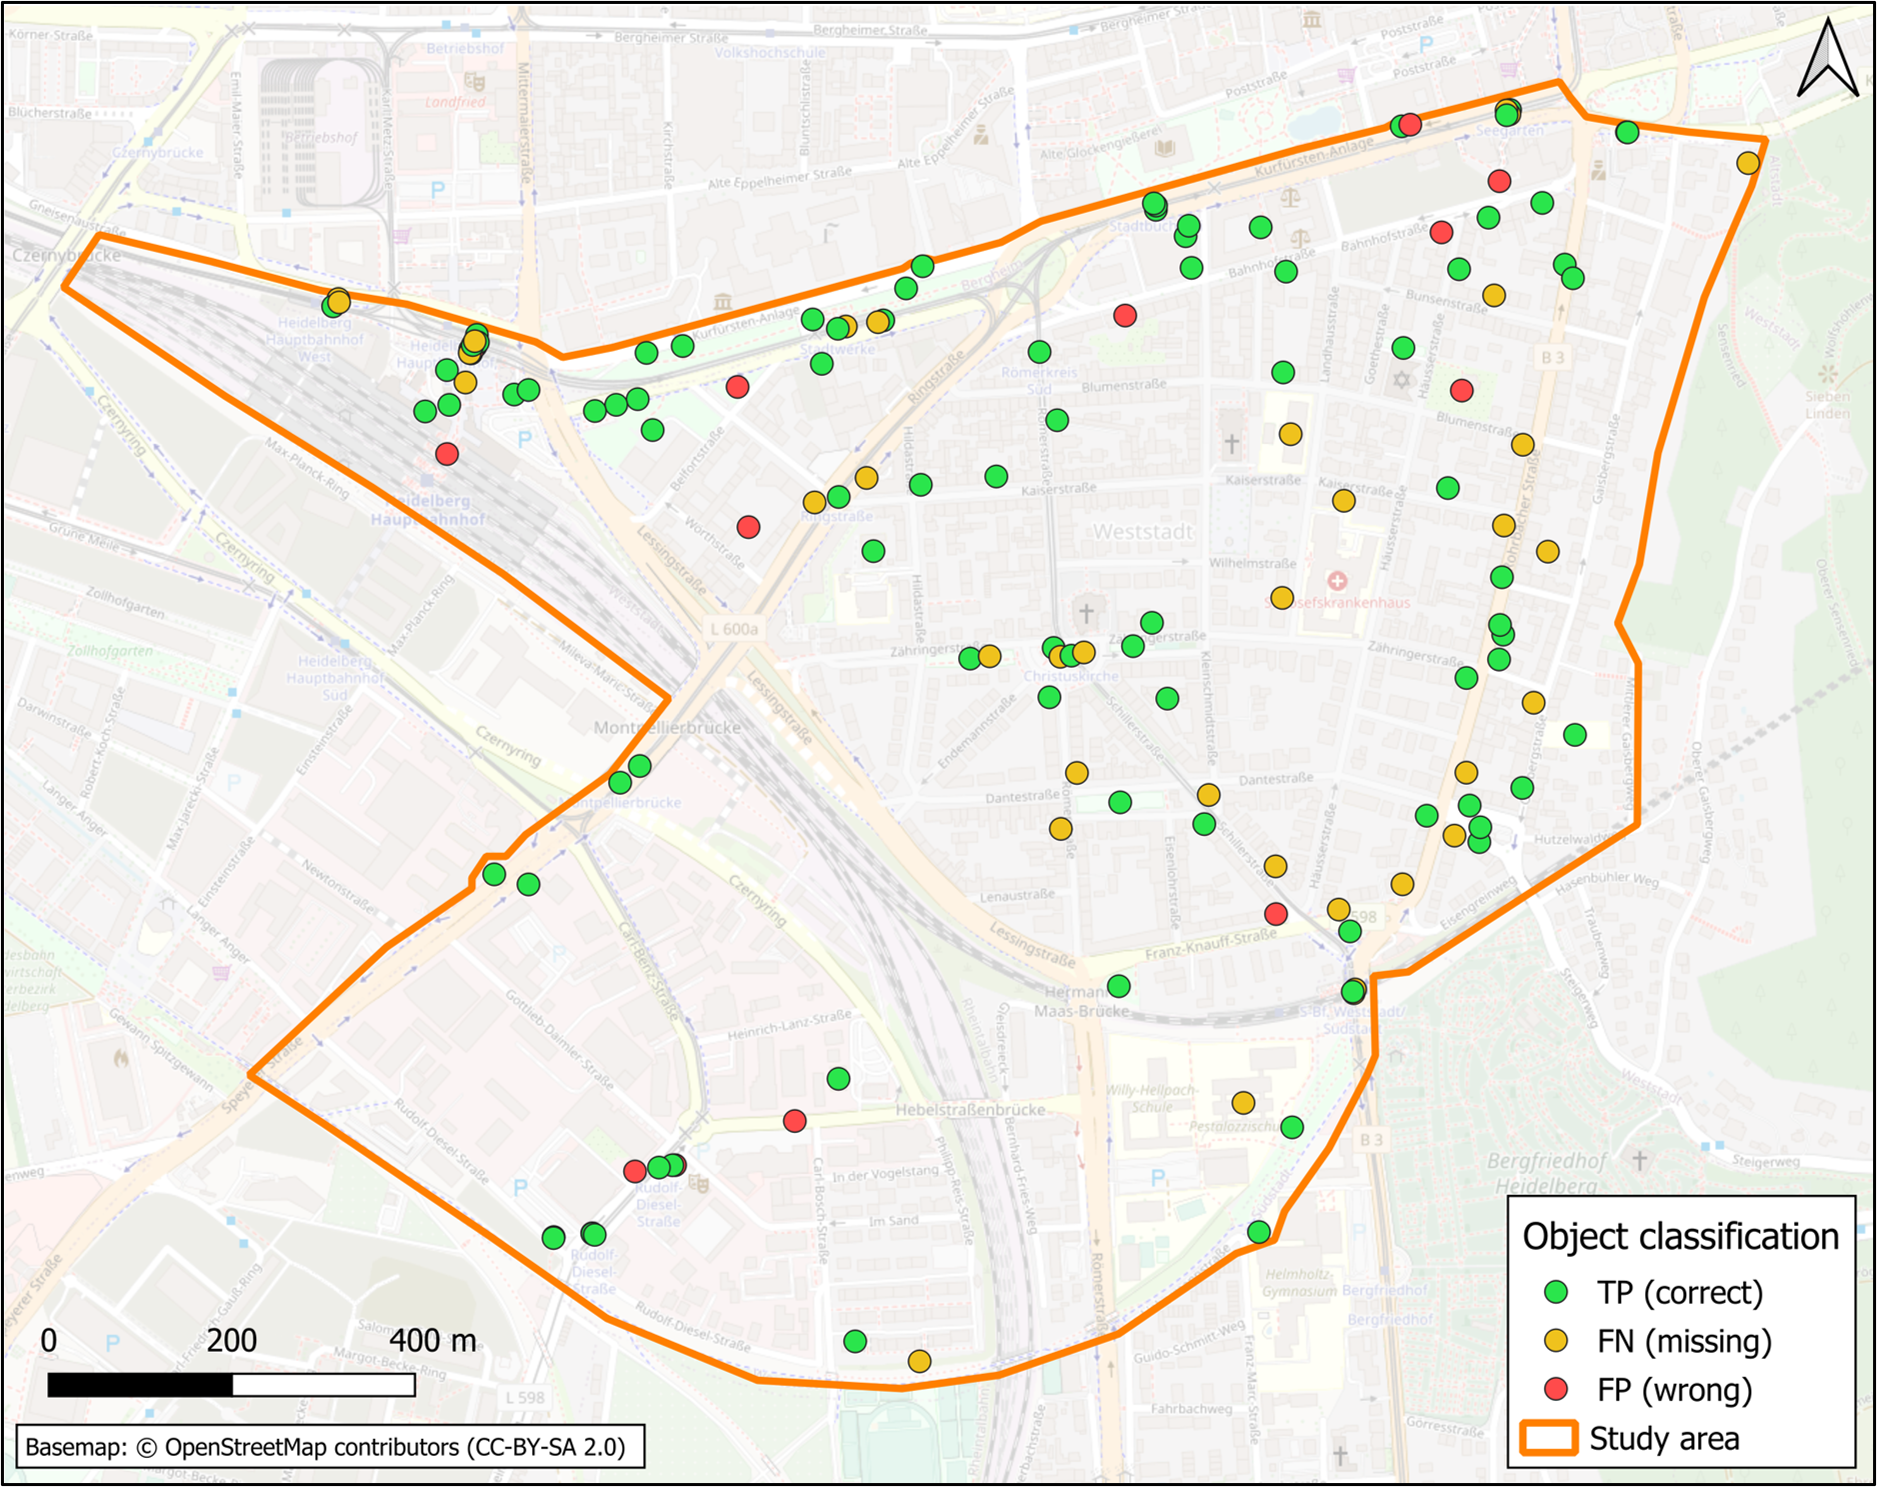
Fig. 4: Example of the object classification in the study area Heidelberg-Weststadt (“HD-WS”)
With the help of this classification the quality parameters could be determined using the formulas depicted in Tab. 2. In addition to the two quality parameters mentioned above, a third parameter (the Critical Success Index = CSI) was calculated, which takes both the missing (FN) and incorrect (FP) objects into account. By that the CSI is a much stricter value than the other two and indicates the overall accuracy.
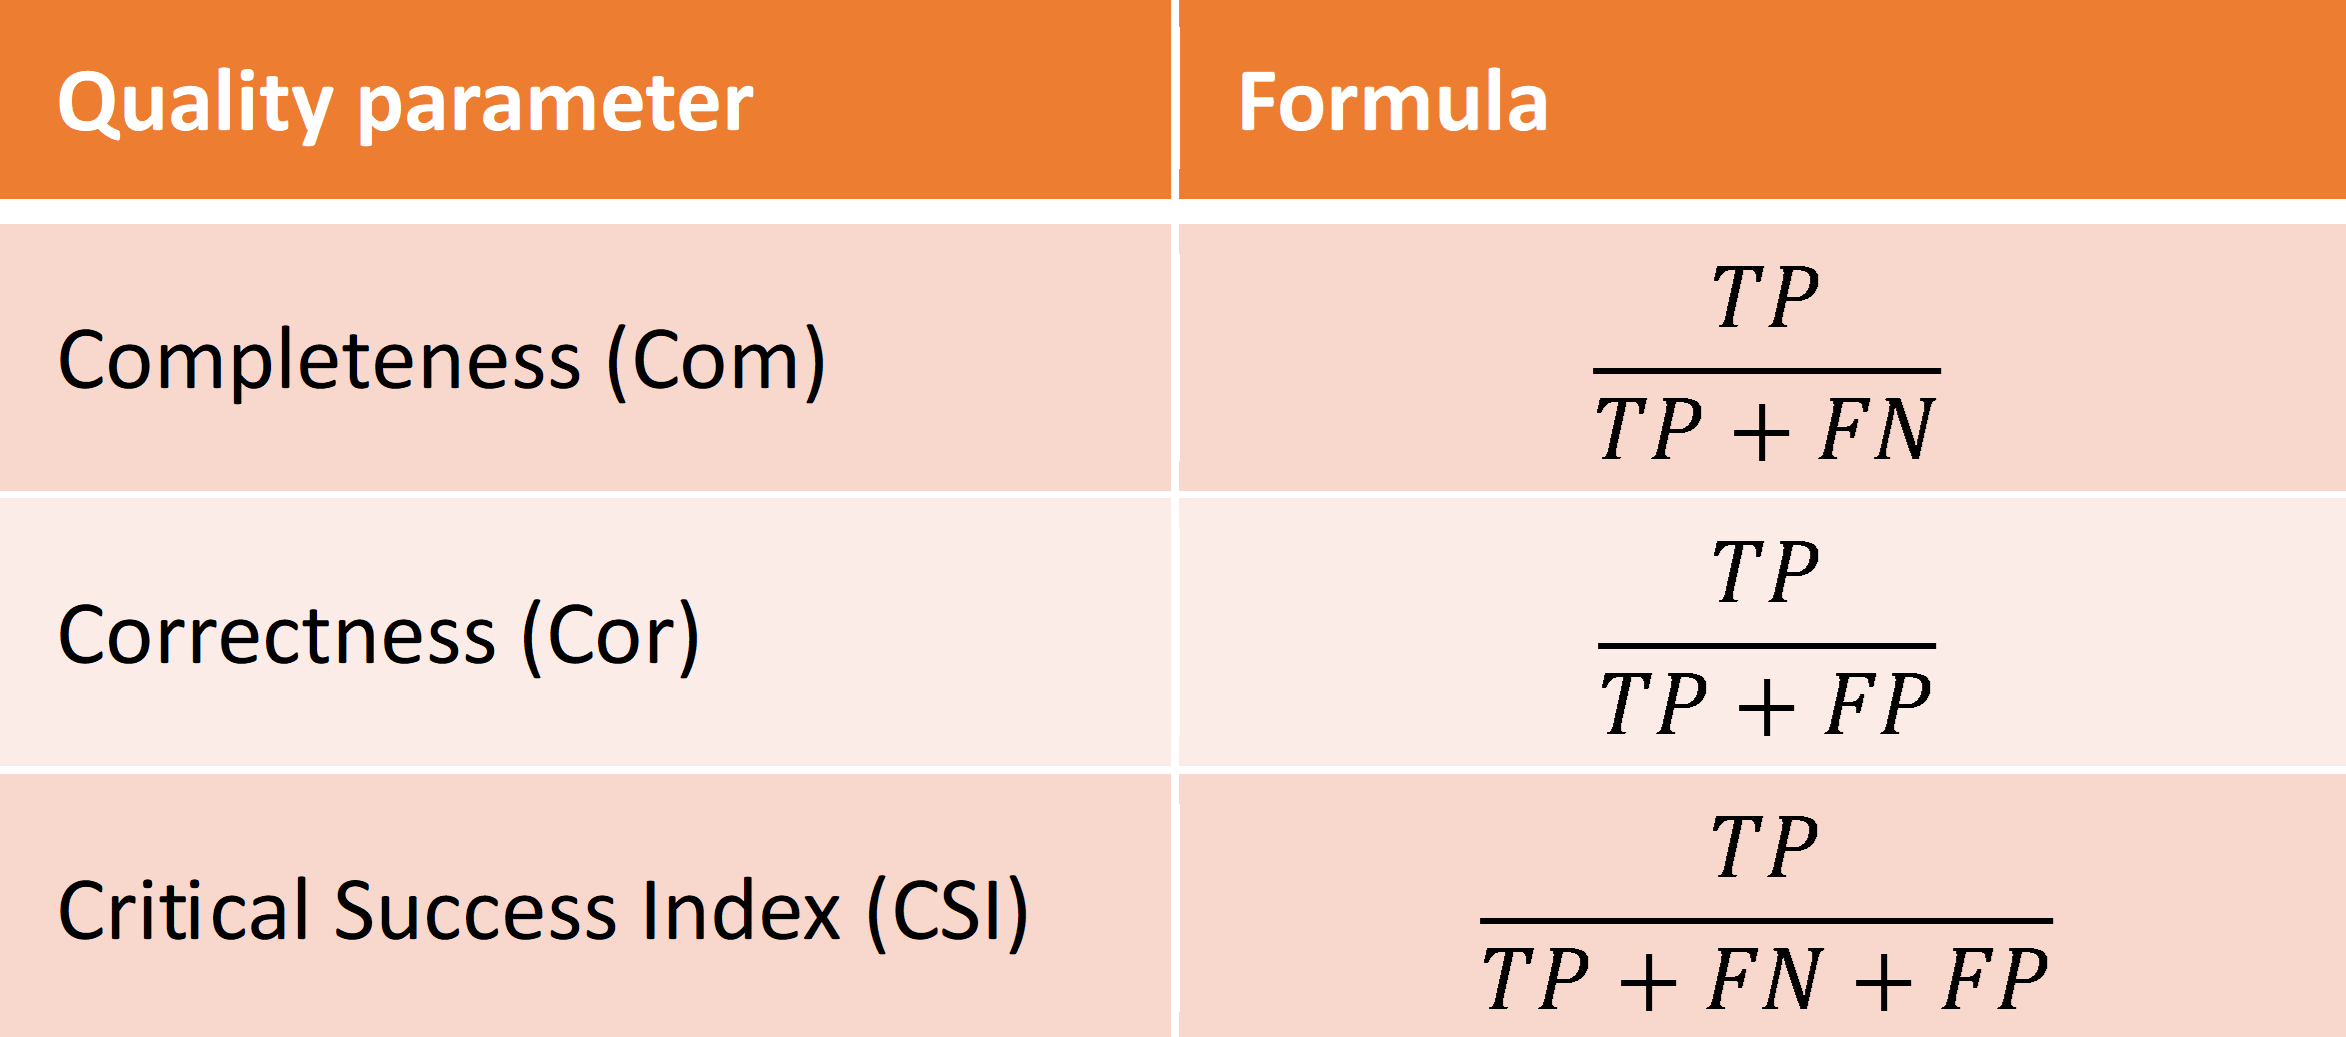
Tab. 2: Formulas of the quality parameters
Results
For the selected study areas and infrastructures OSM shows completeness and correctness values of around 80% each, resulting in an overall accuracy of approximately 66% (s. Fig. 5).
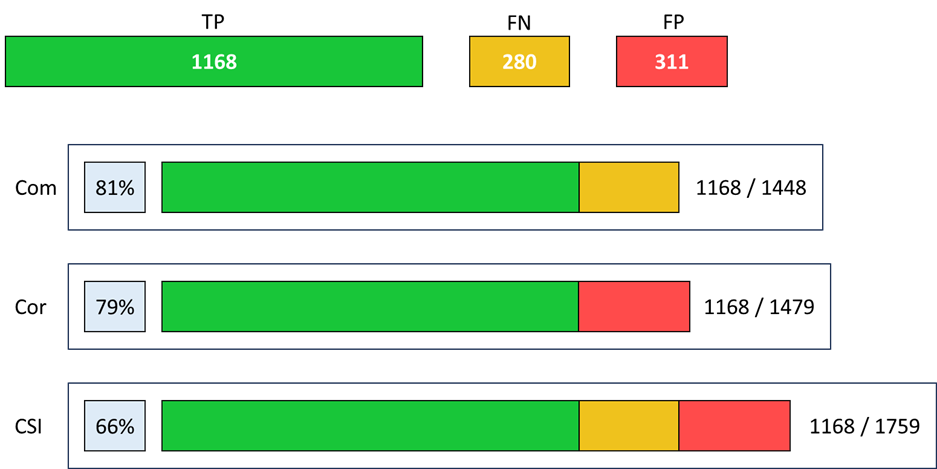
Fig. 5: Quality parameters for the whole dataset
If the quality parameters are broken down by the two regions, it becomes apparent that the differences between them are insignificant (s. Fig. 6).
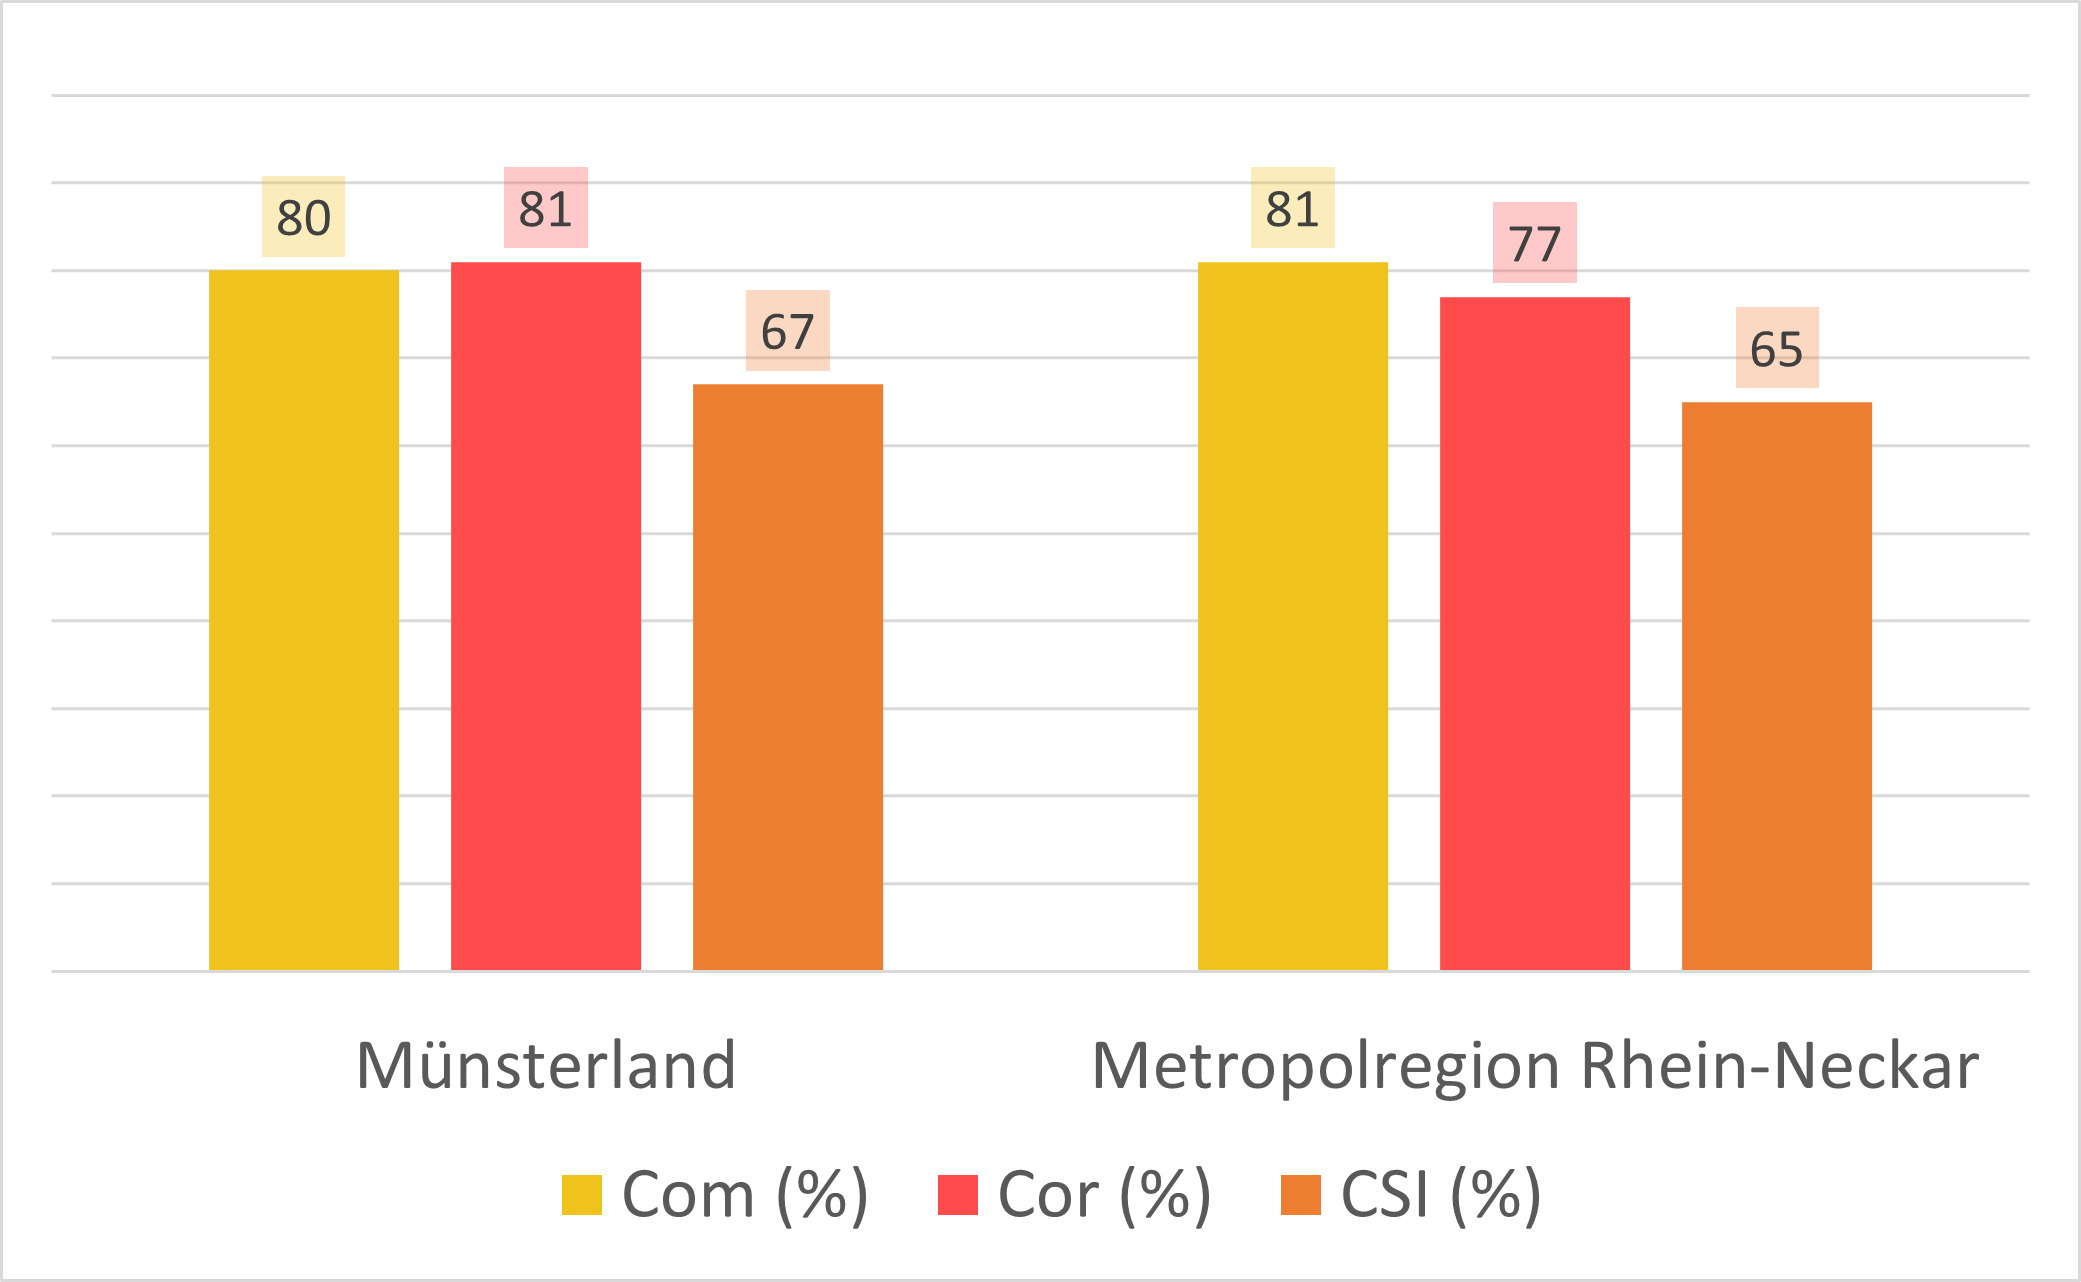
Fig. 6: Quality parameters broken down by region
Breaking down the parameters according to settlement structure indicates an urban-rural gradient, in the sense that rural structures (small towns and villages) show a slightly higher completeness and a much higher correctness (s. Fig. 7).
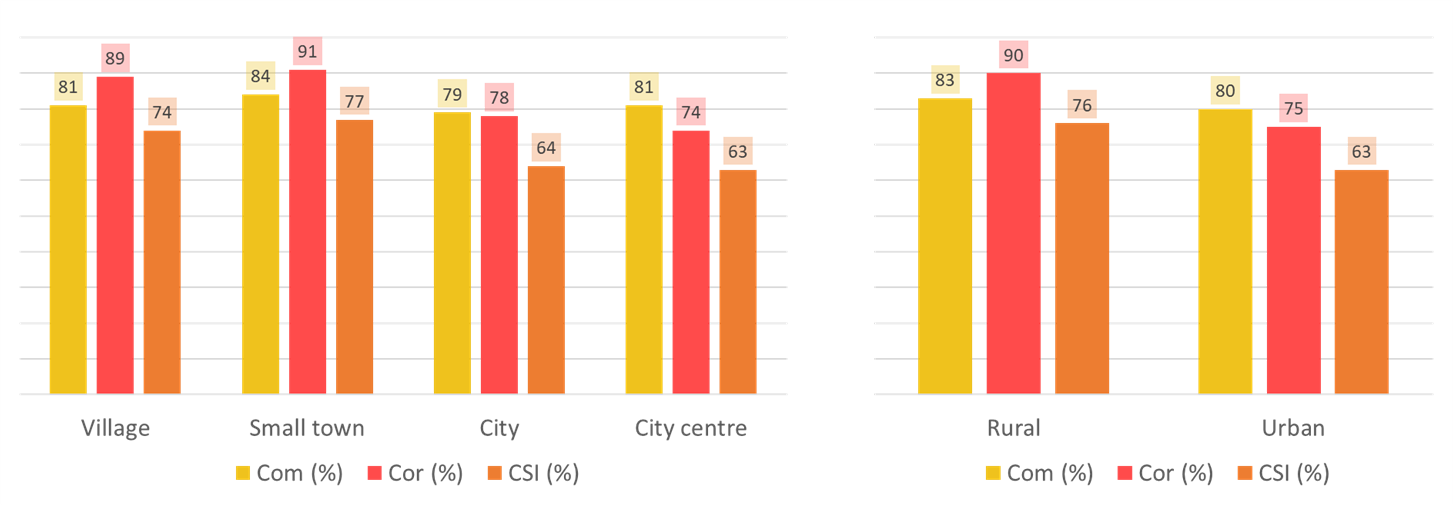
Fig. 7: Quality parameters broken down by settlement structure
An analysis of the parameters for the different types of infrastructure reveals that especially three types (GPs, green spaces and primary schools) show a lower quality while the other types are of higher quality (s. Fig. 8).
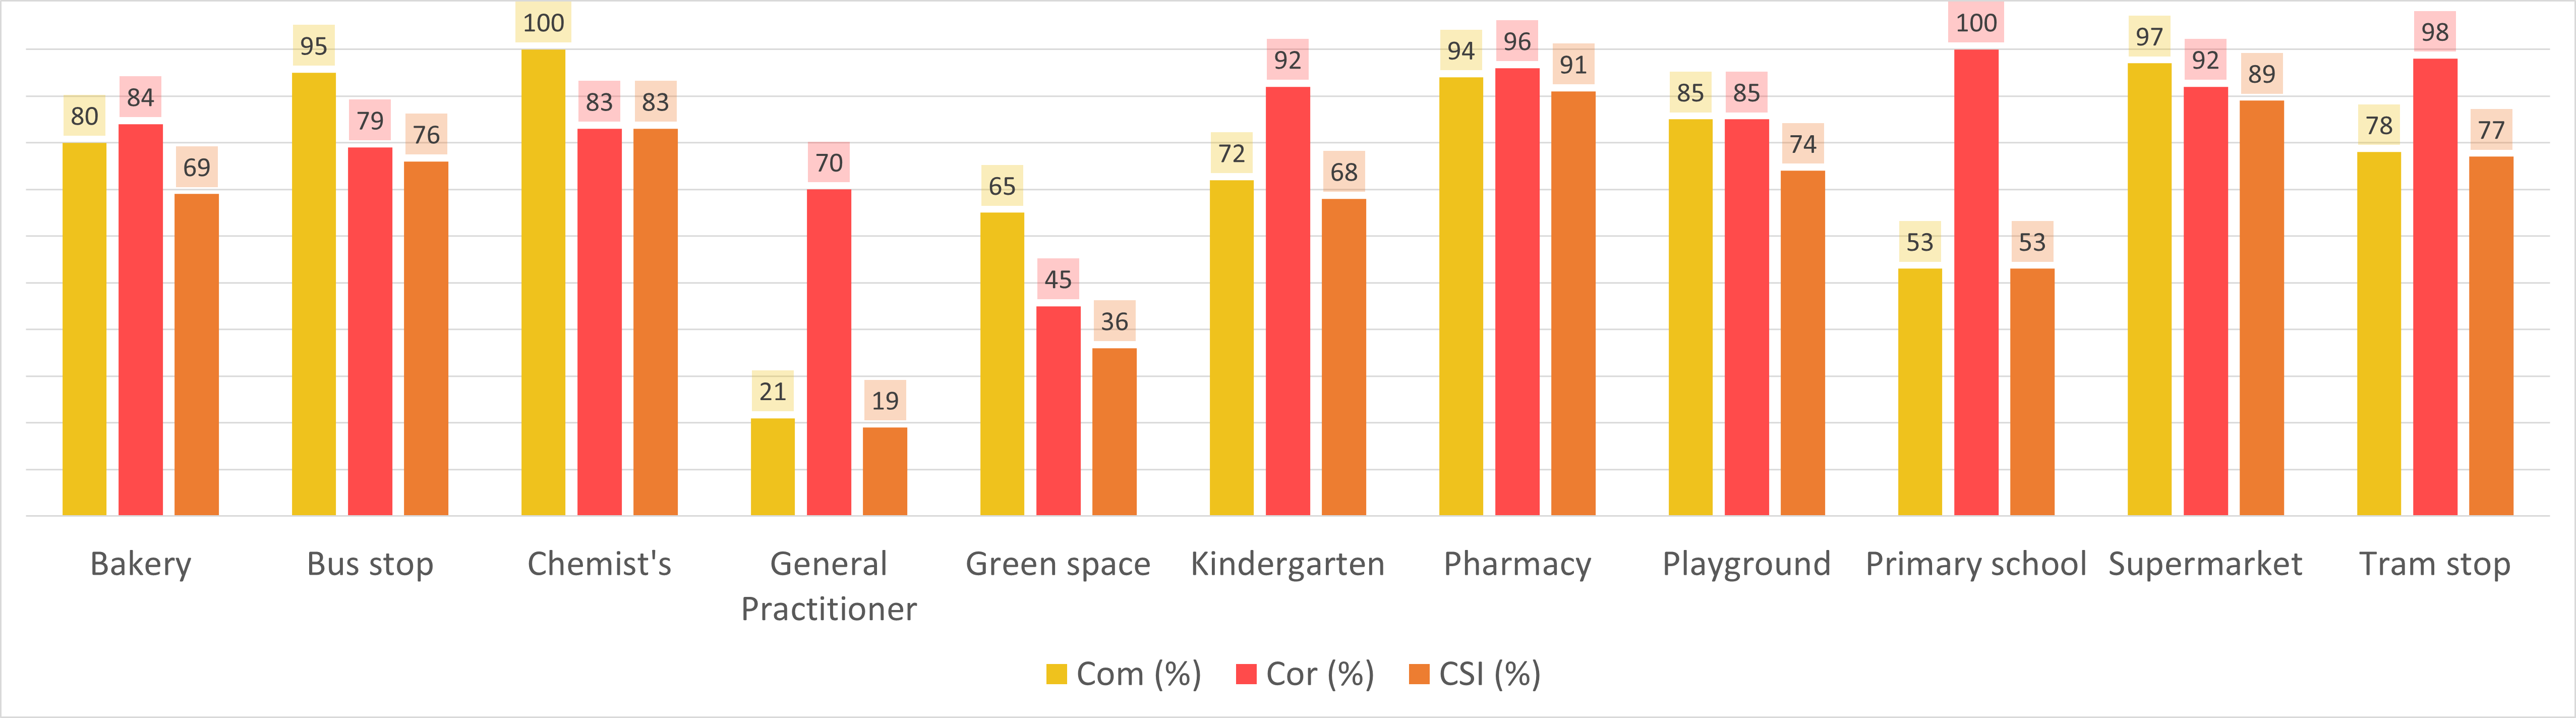
Fig. 8: Quality parameters broken down by infrastructure type
Conclusion
Based on the results OSM provides a solid foundation for the investigated type of location analysis. However, depending on the data quality requirements, it may be necessary to review and supplement the data to ensure a certain level of quality (> 90%) is required.
Larger differences in quality could only be found between the infrastructures (thematic heterogeneity), but not between the spatial units. Even though an urban-rural divide was recognisable, all settlement structures had a decent level of quality, while the difference between the two examined regions was minimal.
Using the tools QField, QGIS and PostGIS Lars took a different approach to HeiGIT’s OSM analysis tool ohsome. However, his research shows that both, extrinsic and intrinsic quality analyses have the possibility to be applied for real world use cases. Check out his technical documentation and HeiGIT’s ohsome dashboard.
To cite the thesis:
- Reckhaus, L. (2023): RealOSM: Eignung von OpenStreetMap für POI-basierte Standortanalysen im Rahmen von Wohnimmobilienprojekten – Eine extrinsische Analyse der Datenqualität. Ruprecht-Karls-Universität Heidelberg. (Unpublished bachelor’s thesis).