

Hello and welcome back to another blog post of the ohsome Region of the Month series where you can learn about potential use cases of the ohsome API. This month we were be looking at the crop tag and tried to find out whether there is a seasonality to the tagging behaviour in OpenStreetMap in different regions. For this, we chose Ireland, Italy, Japan, Madagascar, South Africa and Spain throughout the period of (January) 2008 and (September) 2021. If you are new to this series we recommend to read some of our other blog posts, for example the last one on forest-related tags or the very first on street networks.
Data
As usual, first we got our spatial data sets to use as input boundaries for our requests sent to the ohsome API. We got the boundary data as GeoJSON-files from here, which you could do too if you want to reproduce this analysis. However, for convenience we also provided the data sets used in this analysis in this snippet, so you can use that.
Requests
For our analysis, it was necessary to send more than one request as we were looking at the development of the crop tag from different scales of perspective (crop in general and certain single values) as well as for different regions.
For that, the endpoint elements/area was used and six requests were sent. You could also use the endpoint elements/area/groupBy/boundary instead of elements/area for the general crop requests but since we already had all the single GeoJSON-files it appeared mildly more convenient for us to just use them as they were and send a few more requests.
As filter conditions the following was decided on:
time = 2008-01-01/2021-09-01/P1M
filter = geometry:polygon and crop=*
After these framework conditions had all been established and the inquiries had been sent out, the analysis, which will be reproduced in the following, could begin.
Data exploration
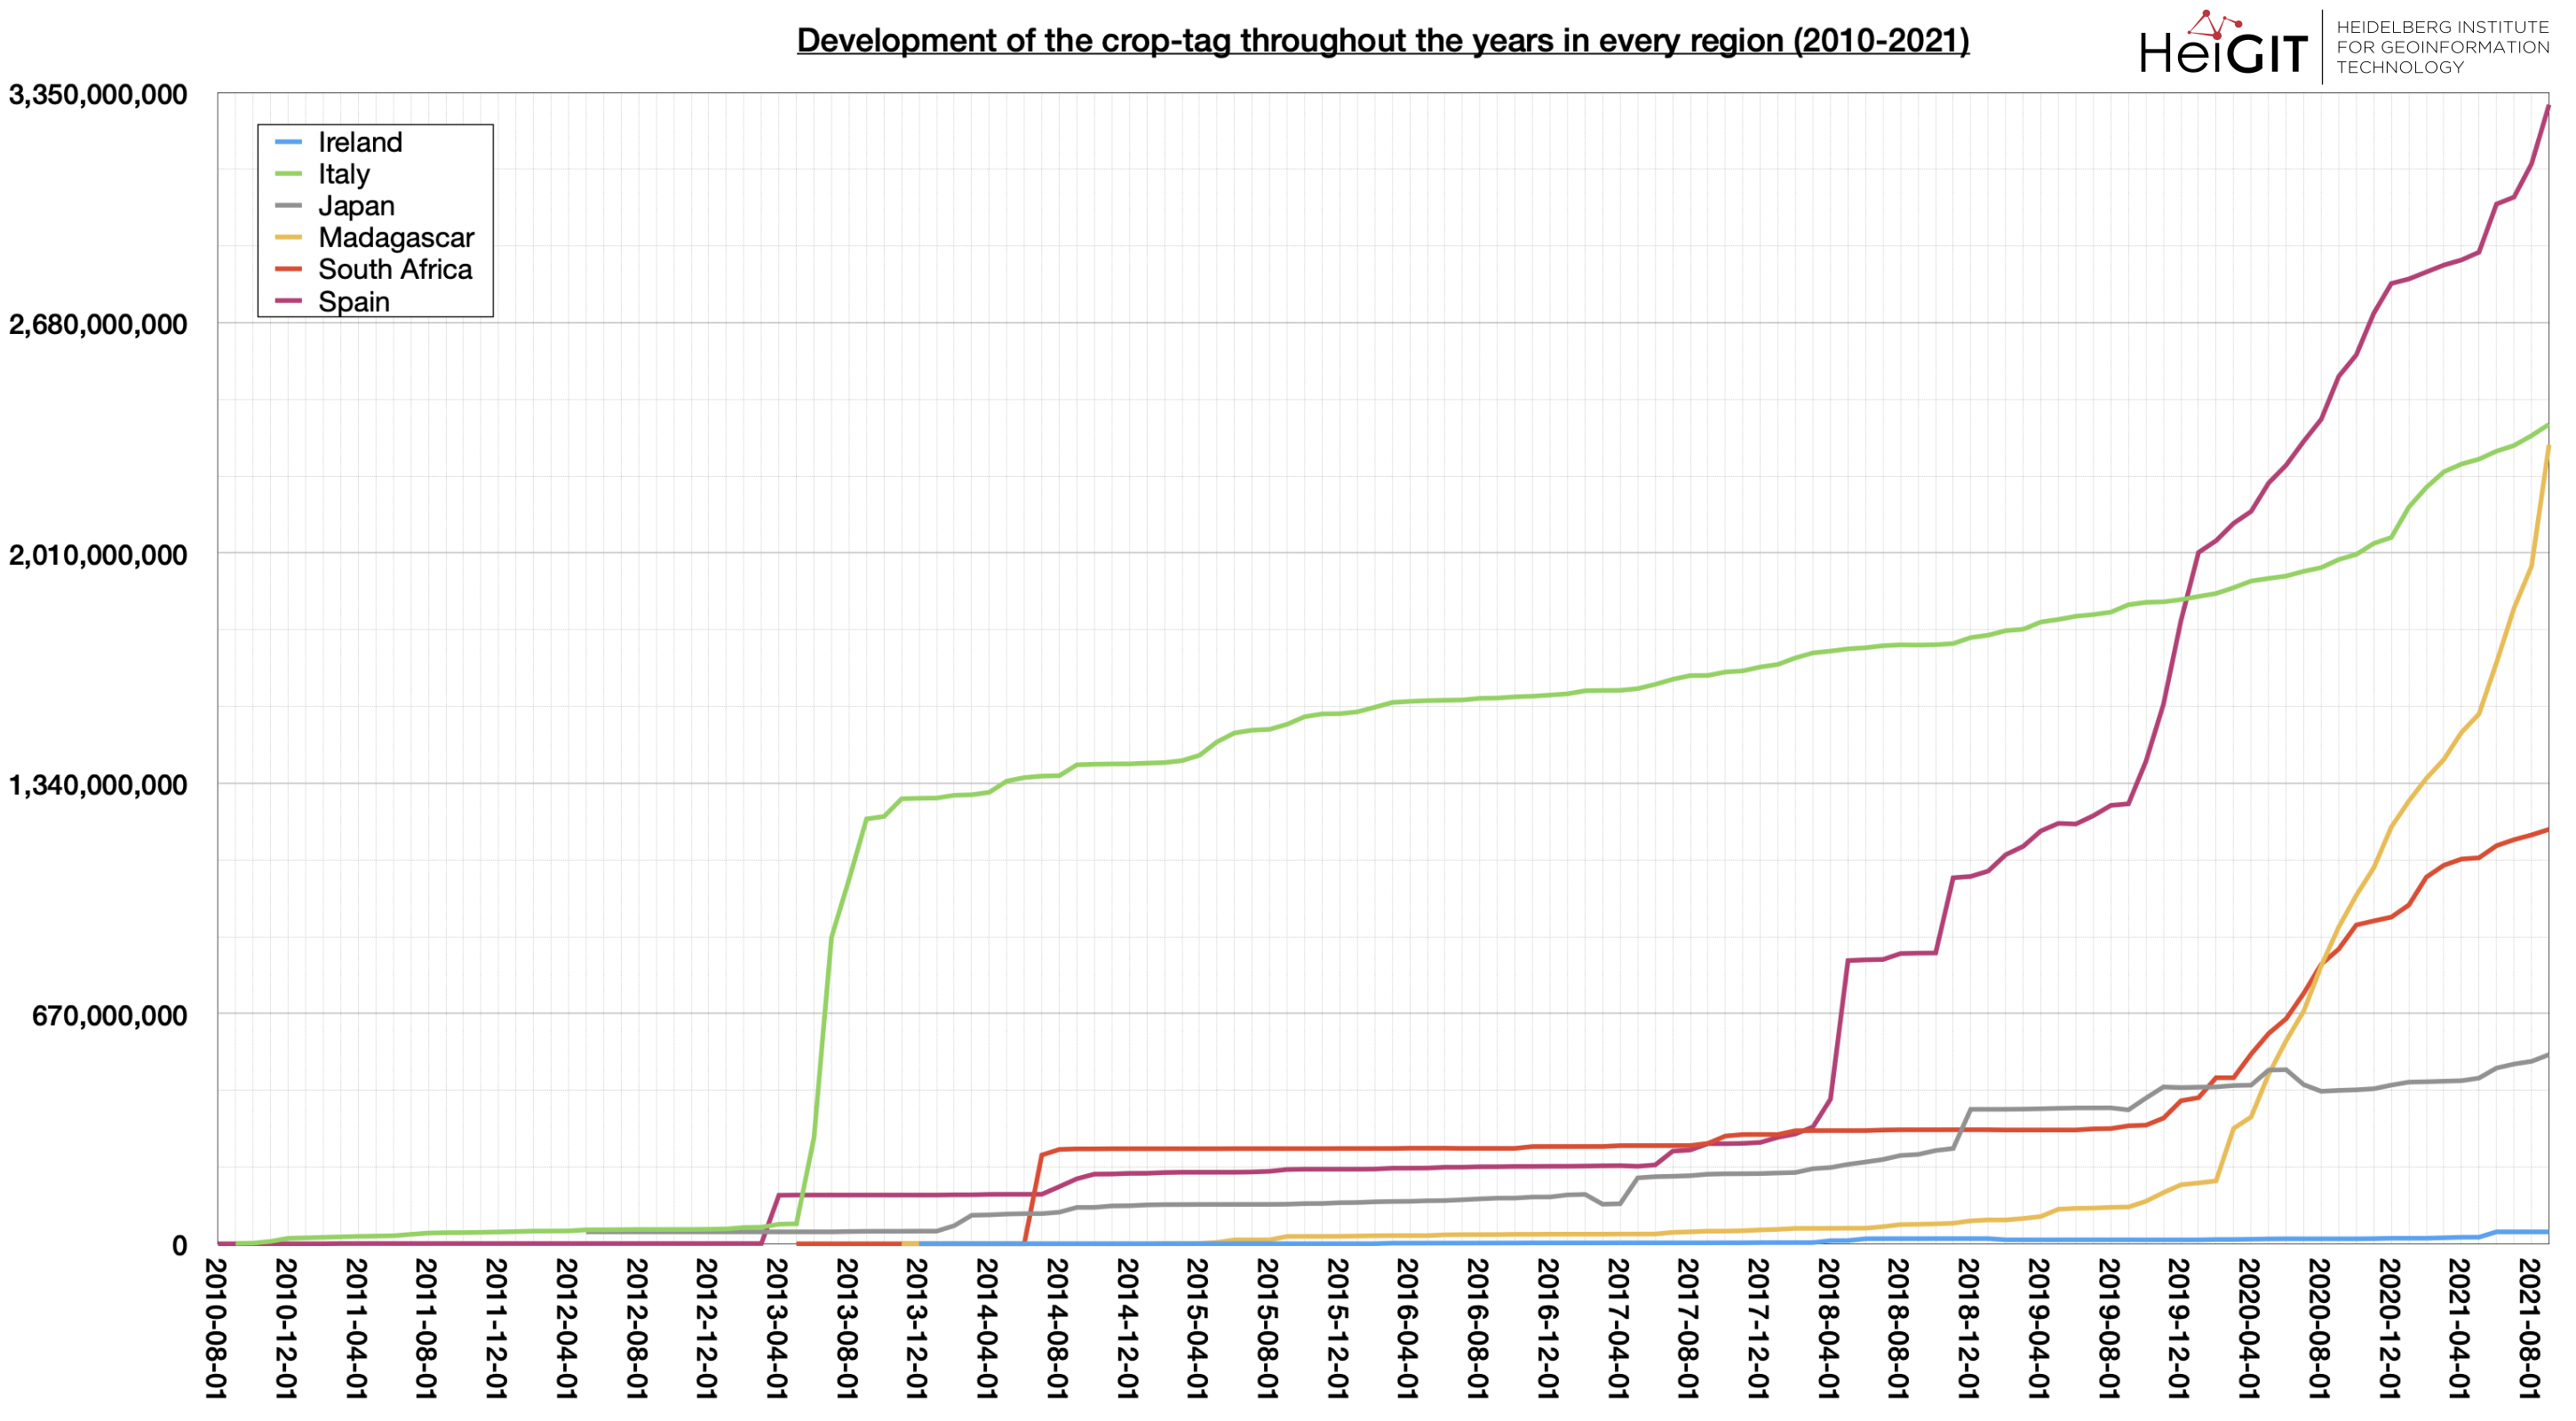
When comparing all of the regions concerning their individual development of the crop tag Italy definitely had the highest values over the longest amount of time. However, Spain displayed the strongest increase, although higher values have only been achieved in recent years. Ireland showed the lowest values with only little development in comparison to every other region looked at, although Japan, too, only displayed rather low values and much less development throughout the years. Madagascar and South Africa both showed only little change for quite a long period of time but also reached higher values for the crop tag within the past two years.
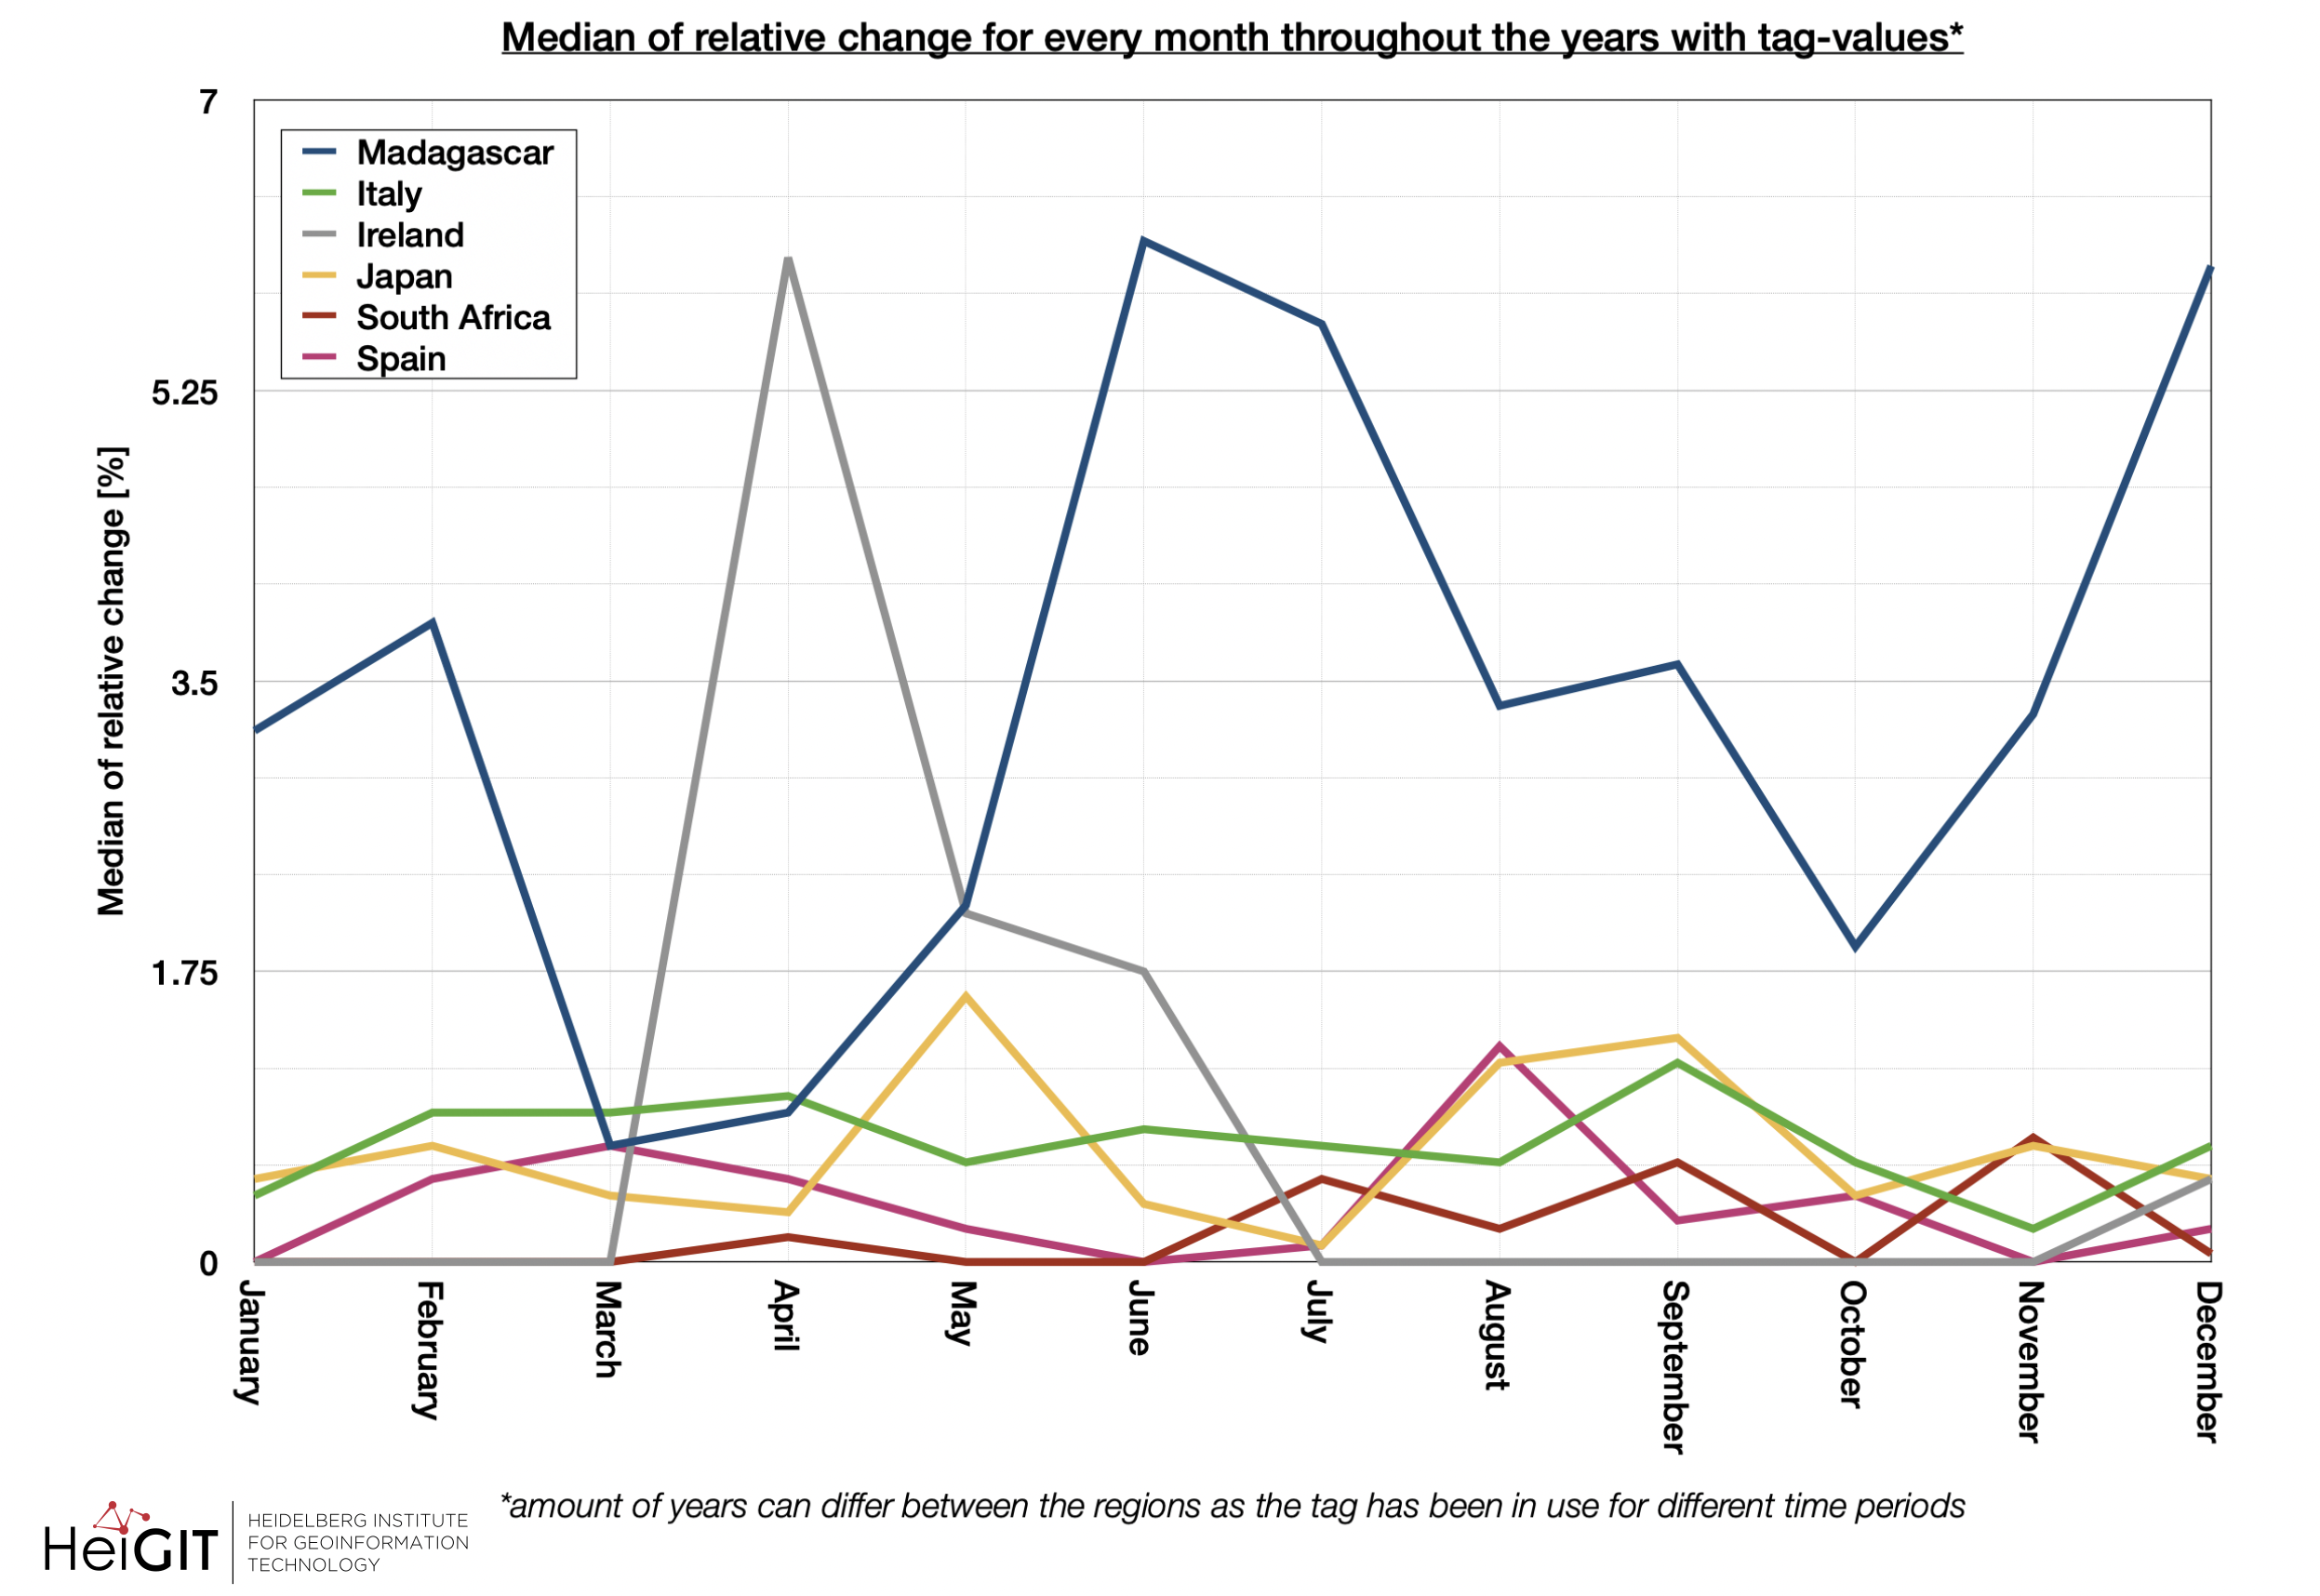

For a general view of the monthly relative change, the monthly mean and the monthly median were determined for all years. The median is much less sensitive to outliers, which is why it is well suited for indicating an average development for the respective regions. Such a calculation resulted in rather low change values, with Ireland with a peak in April and Madagascar with particularly high values in February, June to July, and December being the frontrunners. The arithmetic mean, on the other hand, is intended to indicate the extent of imports/outliers. This can be seen particularly well in the example of South Africa, whose mean value for July is very high based on a single value. As a result, the mean developments of the other regions are also lost.
In the following part of the analysis, we compared the absolute area with relative month-to-month changes of the crop tag. The graphics for each region start with different years as only the years around the first occurrence of the crop tag were used as a starting point.
Ireland
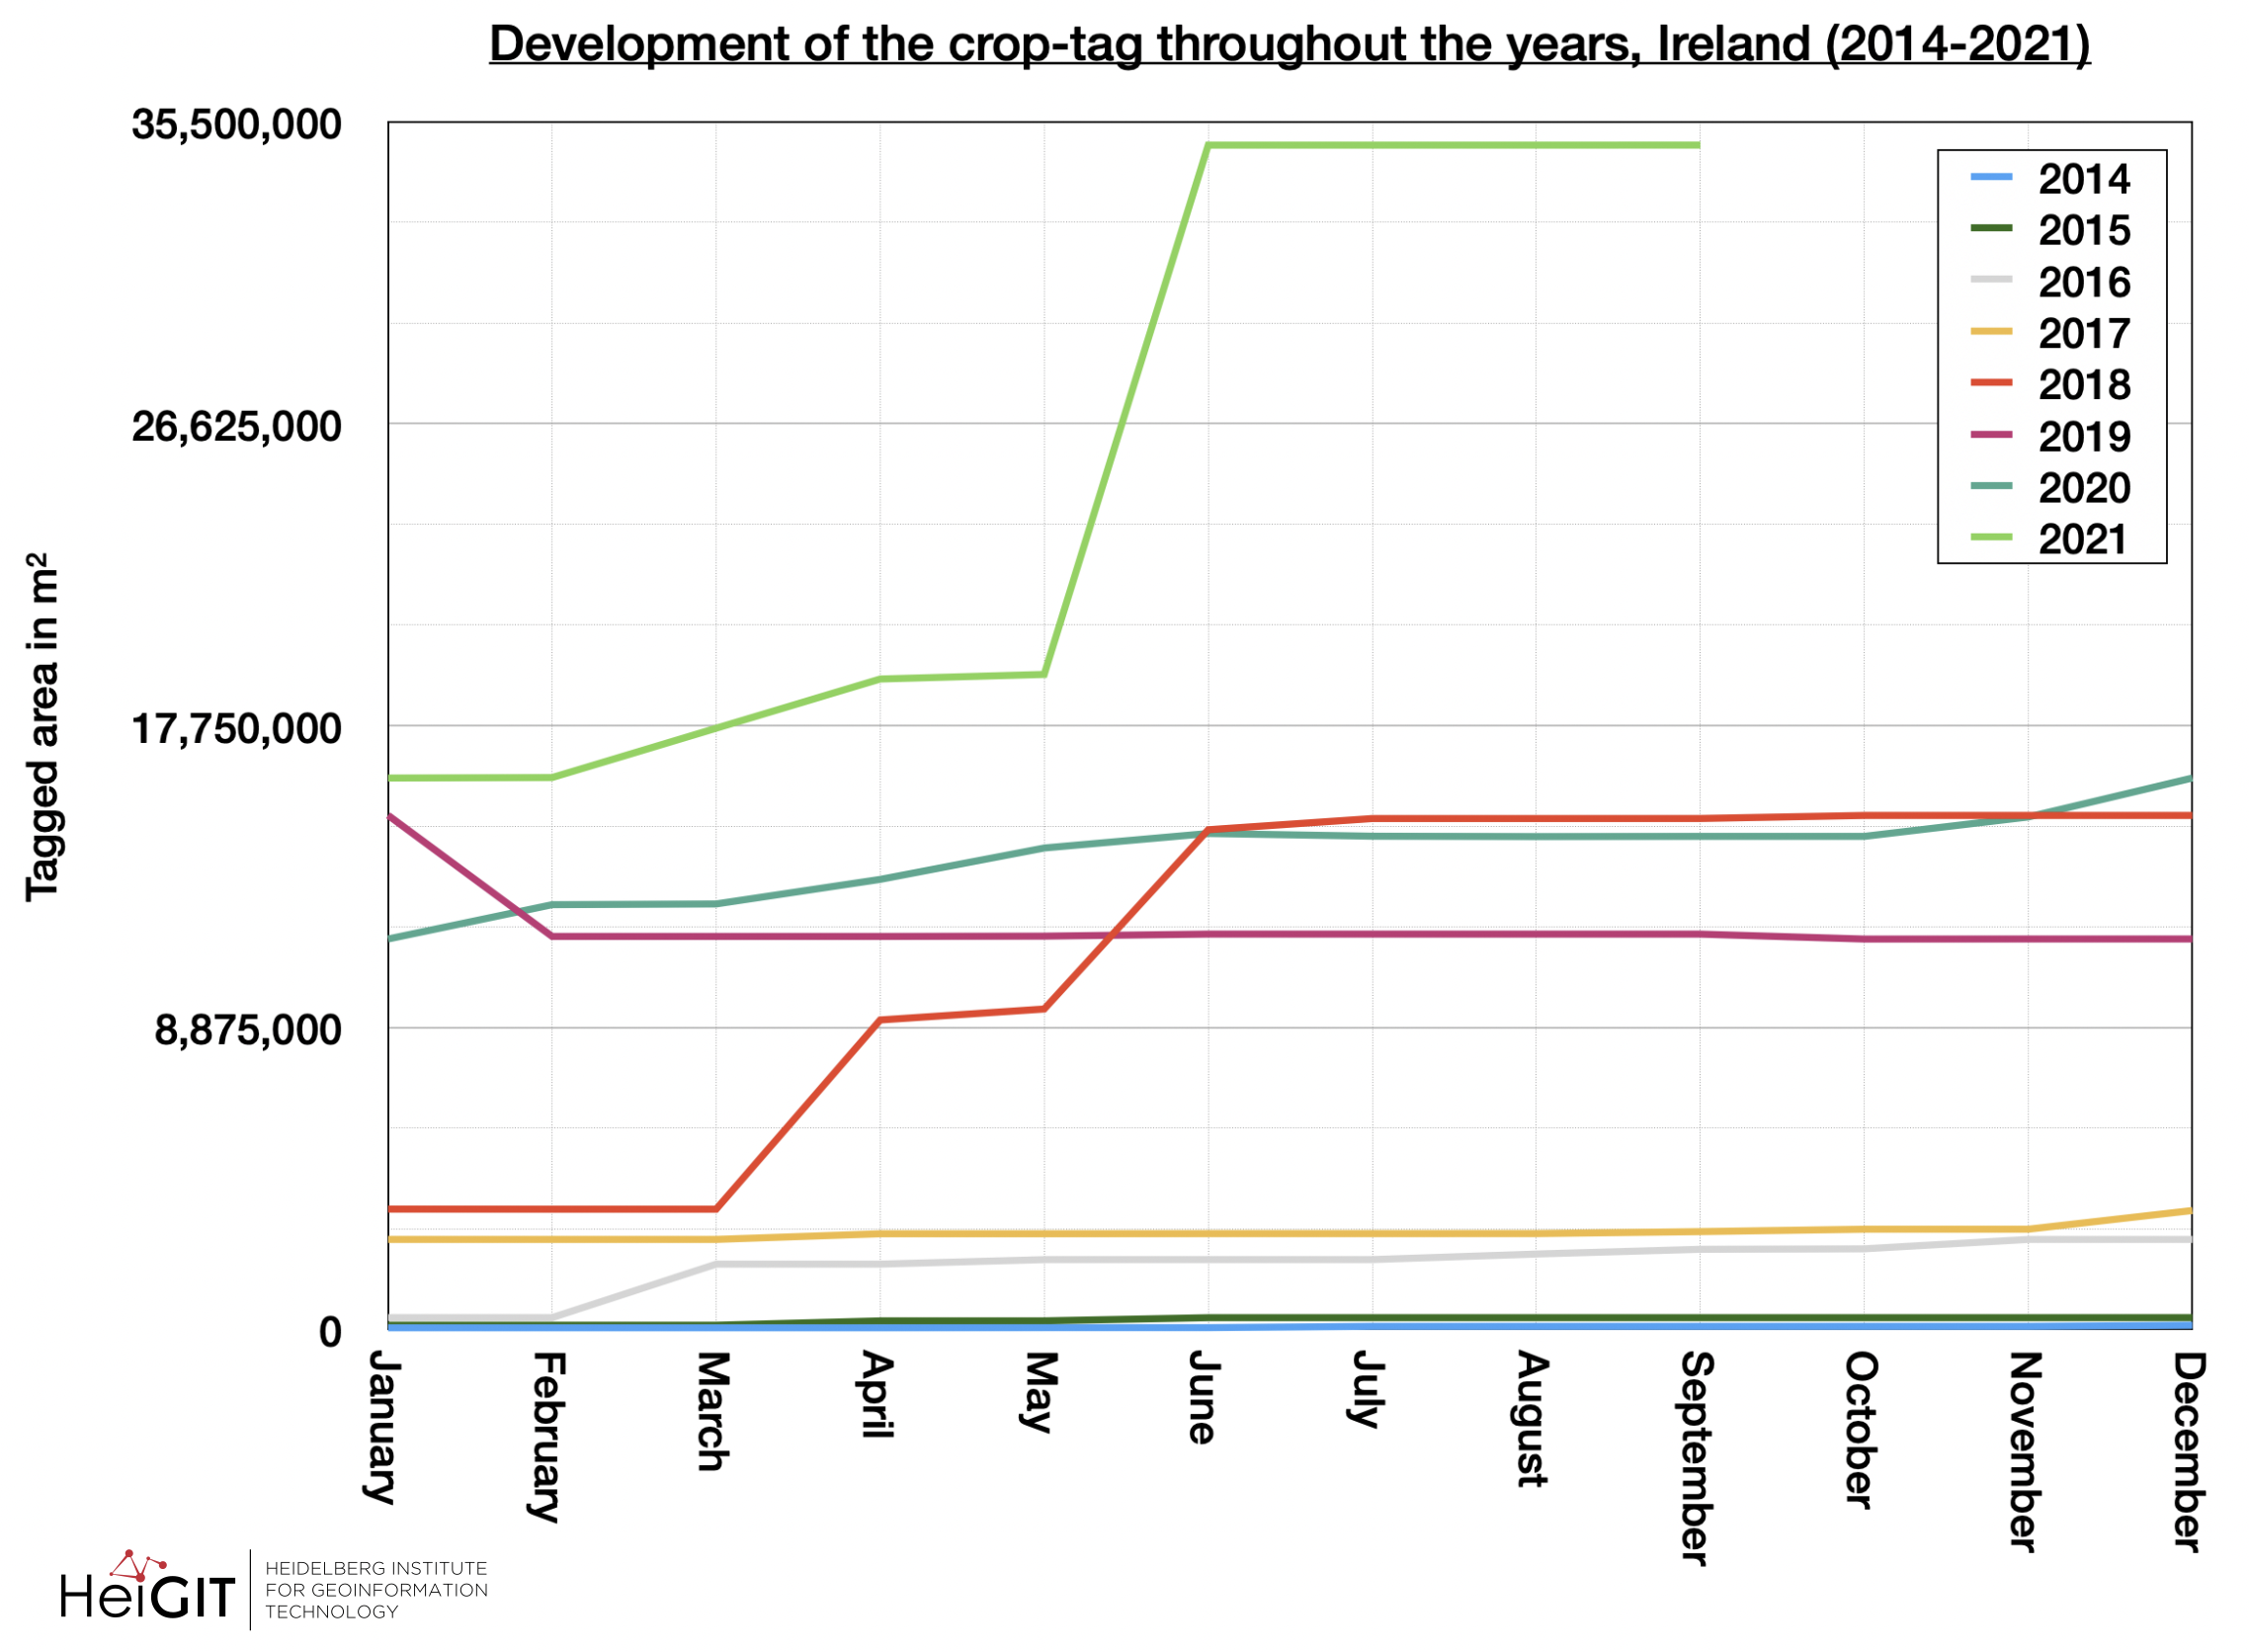
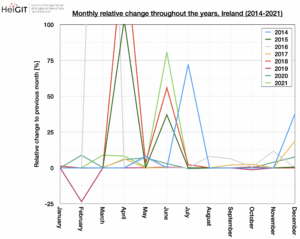
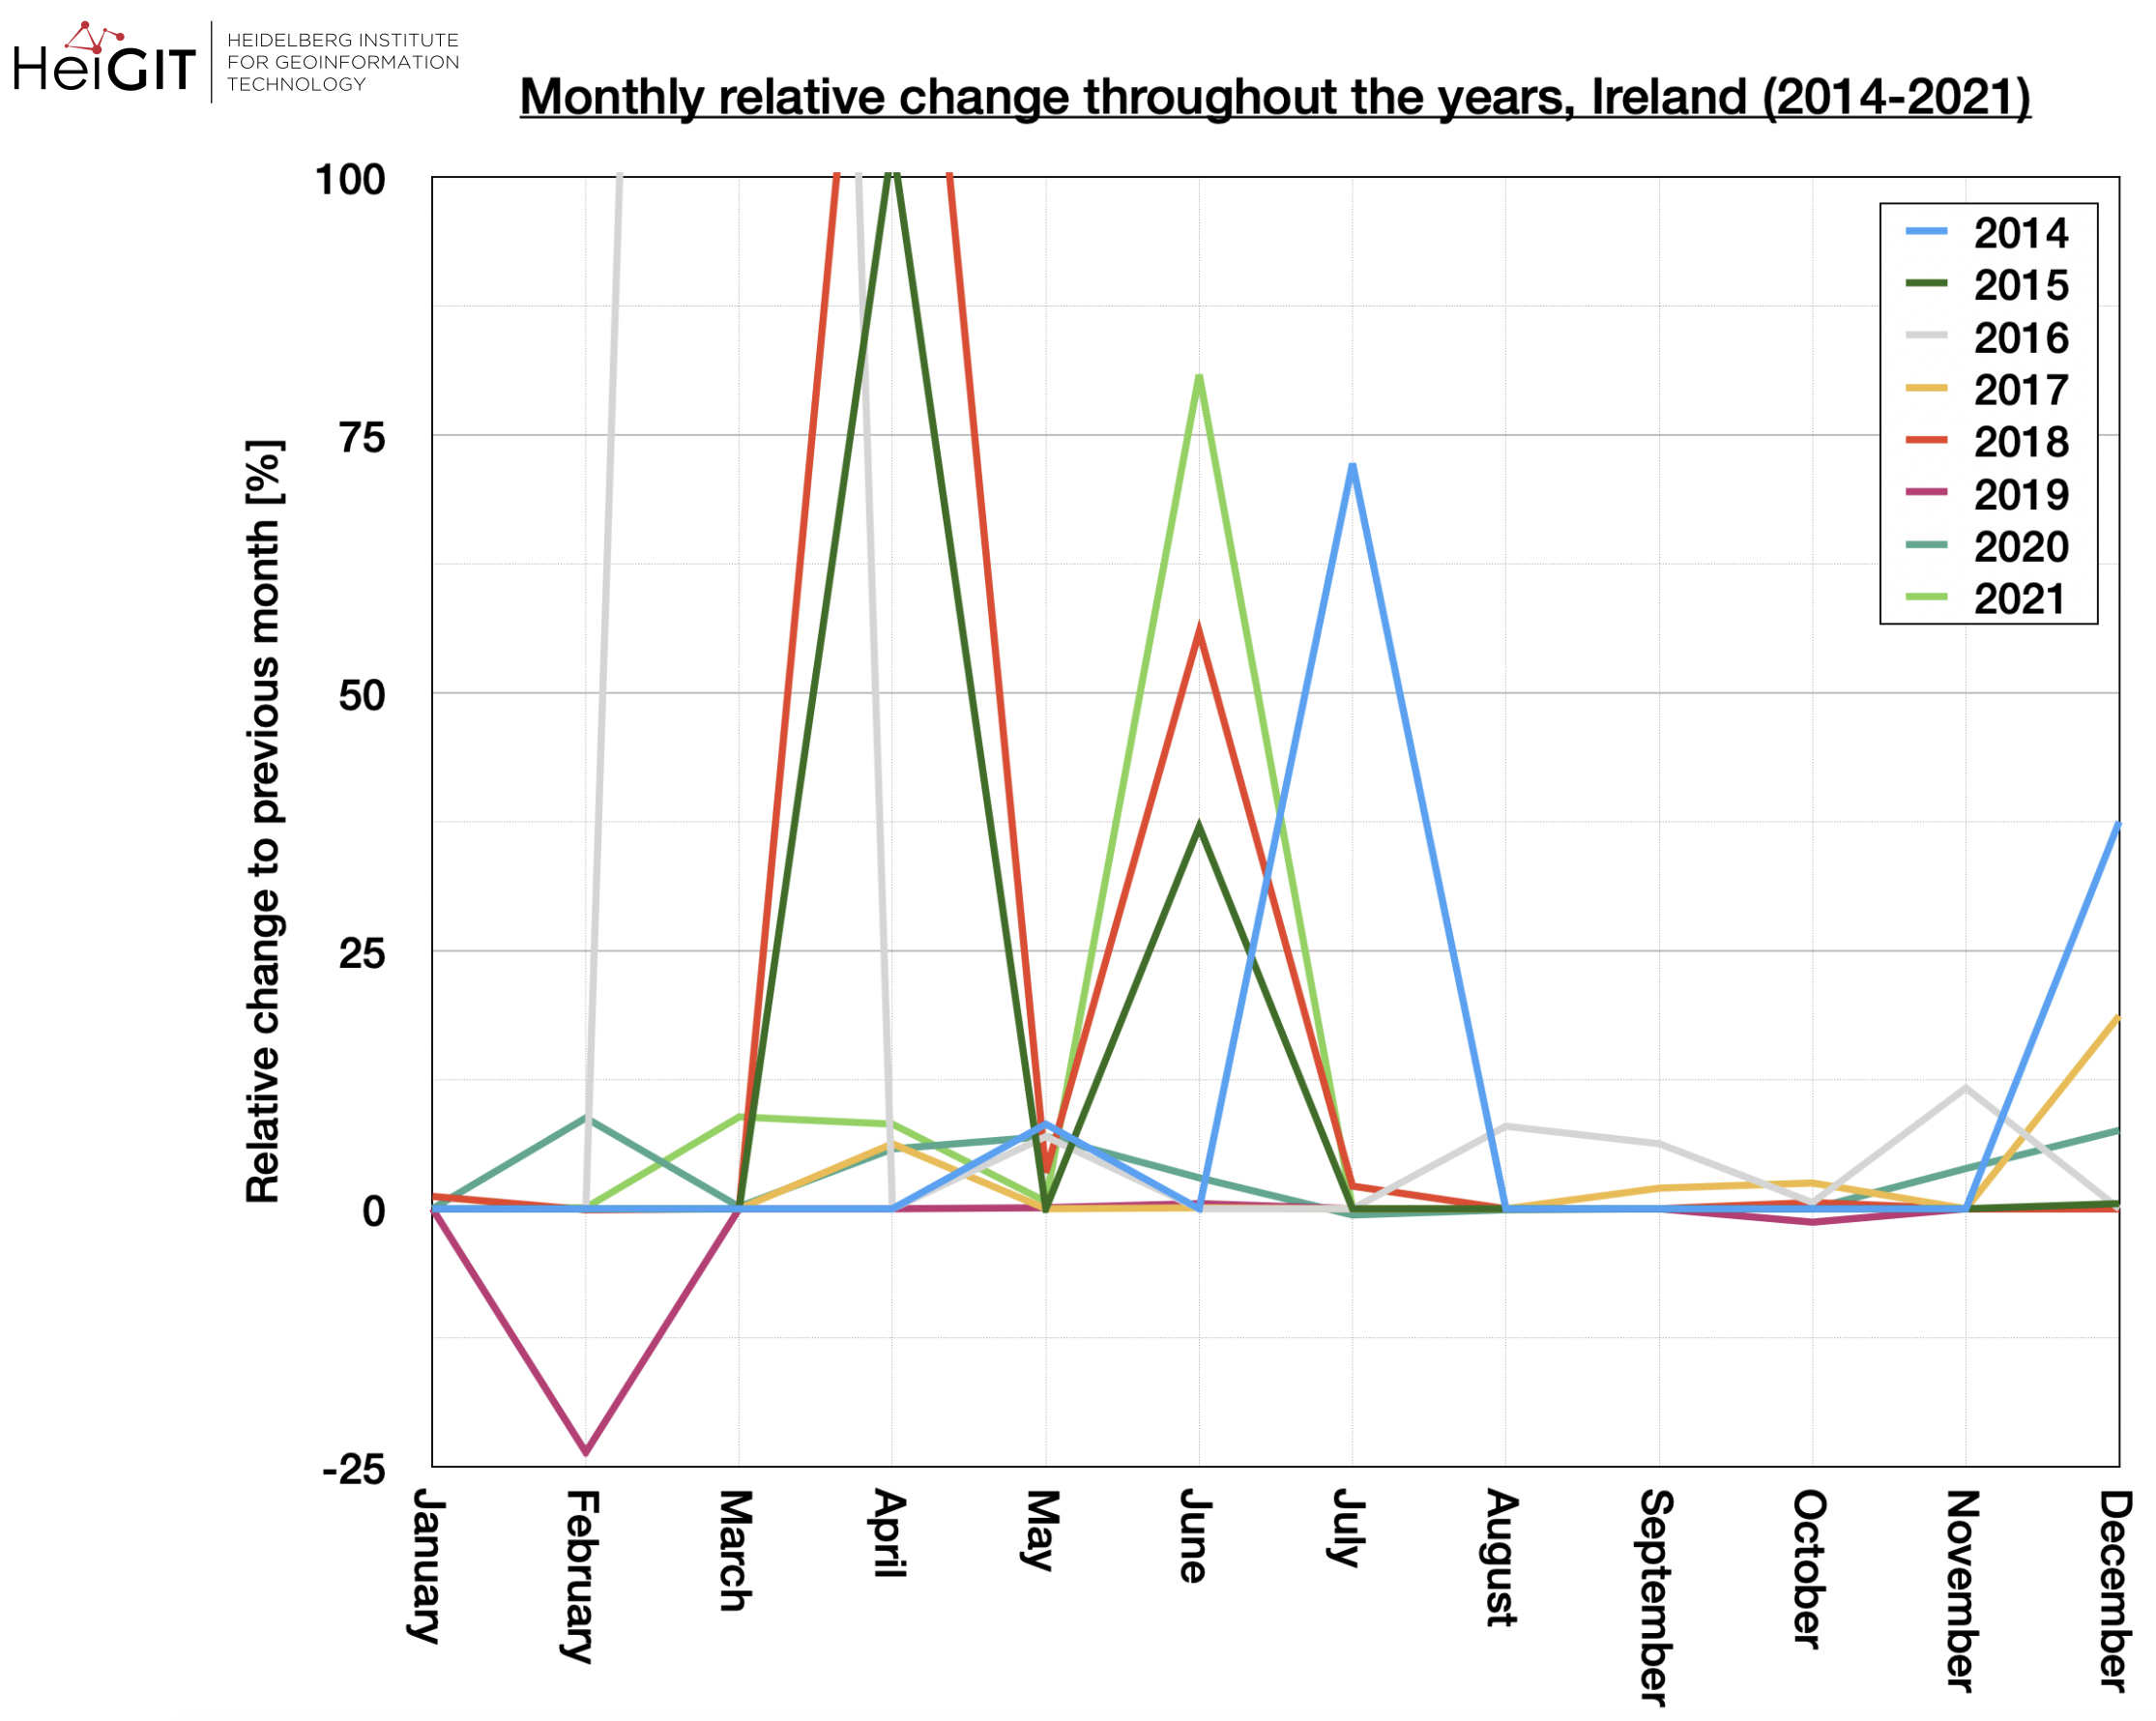
When looking at the development of the crop tag in absolute numbers, i.e. the area that the tag occupies within Ireland, an increase over the years is noticeable, as expected. While the generally very low values between 2014-2017 are still very low, there is a stronger increase from March, possibly due to imports, in two stages. The first in March and the second throughout May. After rather small changes in the rest of 2018, a drop in values occurs between January and February 2019, which is not followed by large changes. Thus, part of the added data has been deleted again. In the two following years, the values increase again, whereby a data jump in May 2021 stands out, which is most likely linked to the addition of a relation. The most active years in terms of relative change are 2014, 2015, 2018, and 2019. In general, there seems to be quite a lot of change in the region, with the period between March and July seeming particularly prone to strong change, sometimes including December. Particular peaks appear in July and December 2014, April and June 2015, April and June 2018, and a change minimum was reached in February 2019.
Apart from quite a few peaks throughout the summer months, no clear seasonal trend can be confirmed.
Italy
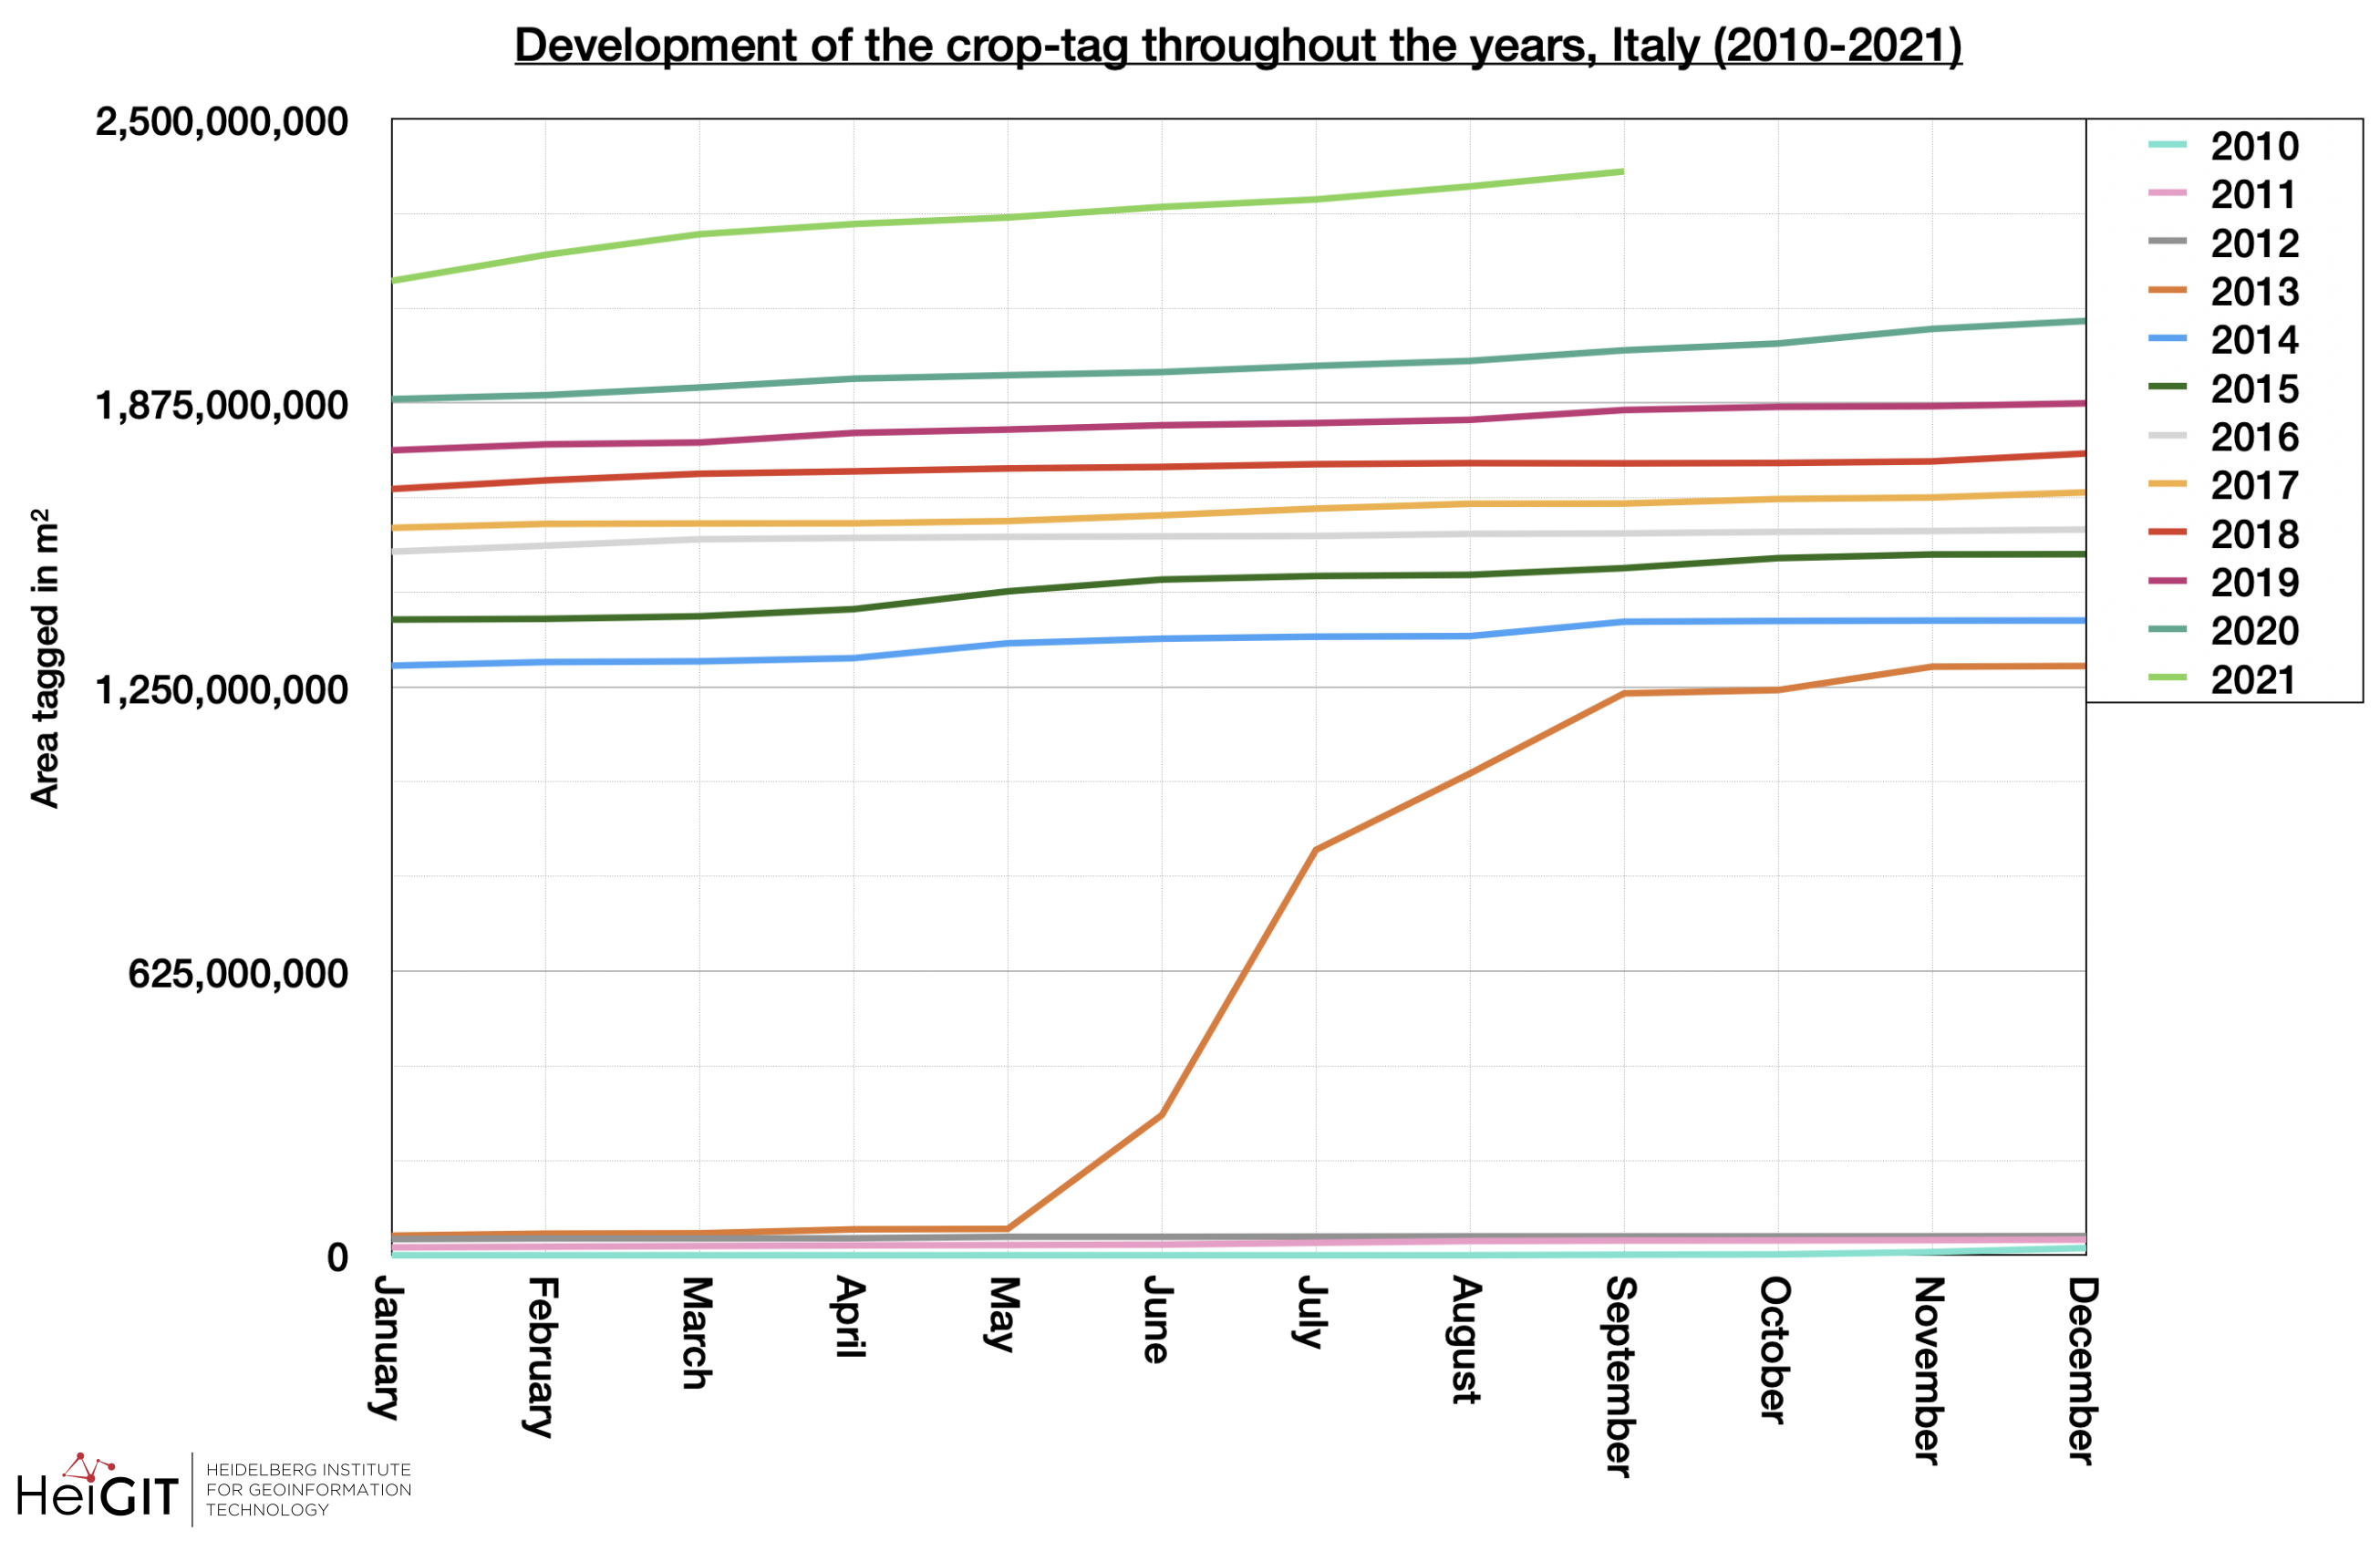

For Italy, an overall analysis of the absolute numbers within a graph shows rather unspectacular changes. However, there is a more or less continuously increasing trend, which could speak for a general tagging activity independent of imports. A single exception to this can be found between May and September 2013, which is the only time that such a strong jump in data can be found. In June 2013 began an Import process which does one the one hand fit the timeframe of the strong increase, on the other hand the content of the import data – house numbers – does not match with the examined crop tag.
Since there is an enormous increase over the years, intra-annual variations are partially lost and such an observation does not initially provide any indication of seasonal tagging behavior.
When considering the relative change each month in comparison to the previous month the values for the years often differ. There was a strong increase by the end of 2010, starting in September, and again between May and August 2013. Both of them might be data imports. The year 2013 is generally more active in terms of change in values which poses the question of whether there has been generally more activity concerning the crop tag or there have been more imports than usual. The rest of the values throughout the years barely exceed a change of 10% although during the summer months of 2011 values of up to 20% change could be reached. There appears to be no outstanding seasonal trend for the crop tag in Italy.
Japan
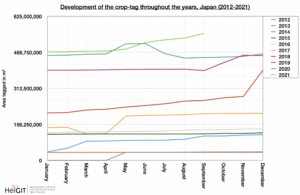

With regard to the absolute crop-area in Japan, certain data jumps can be recognized, but these are not unusually large. Values first appear starting in May 2012, but only really begin to change again between January and March 2014. This is followed by a two-year steady slight increase until 2017, when stronger changes are found again. First, data was deleted over February, but more data was added back than was deleted during April. After another rather even increase in 2018, a jump in data is again found from November and the new crop value does not change again until August, where it increases again until November after a very slight decrease. After a new increase with subsequent data deletion takes place between April and August 2020, the values only increase until the end of the period considered.
Considering the relative changes, no greater outliers could be identified for Japan. Still, there are quite high values from January to April 2014 as well as another peak in September. Whilst in March 2017 a minimum value is reached and in May the values are peaking. The subsequent year appears generally more active as changes are taking place nearly every month.
Over the months of October and November 2019, quite high values are achieved anew, after which values in the negative range are briefly manifested in September, so data were deleted. As a result of a strong positive development in May 2020, a second minimum is reached in July. Although the values of the year 2021 are far less high, these also show an increasing tendency. There seems to be no seasonality in the tagging behaviour.
Madagascar


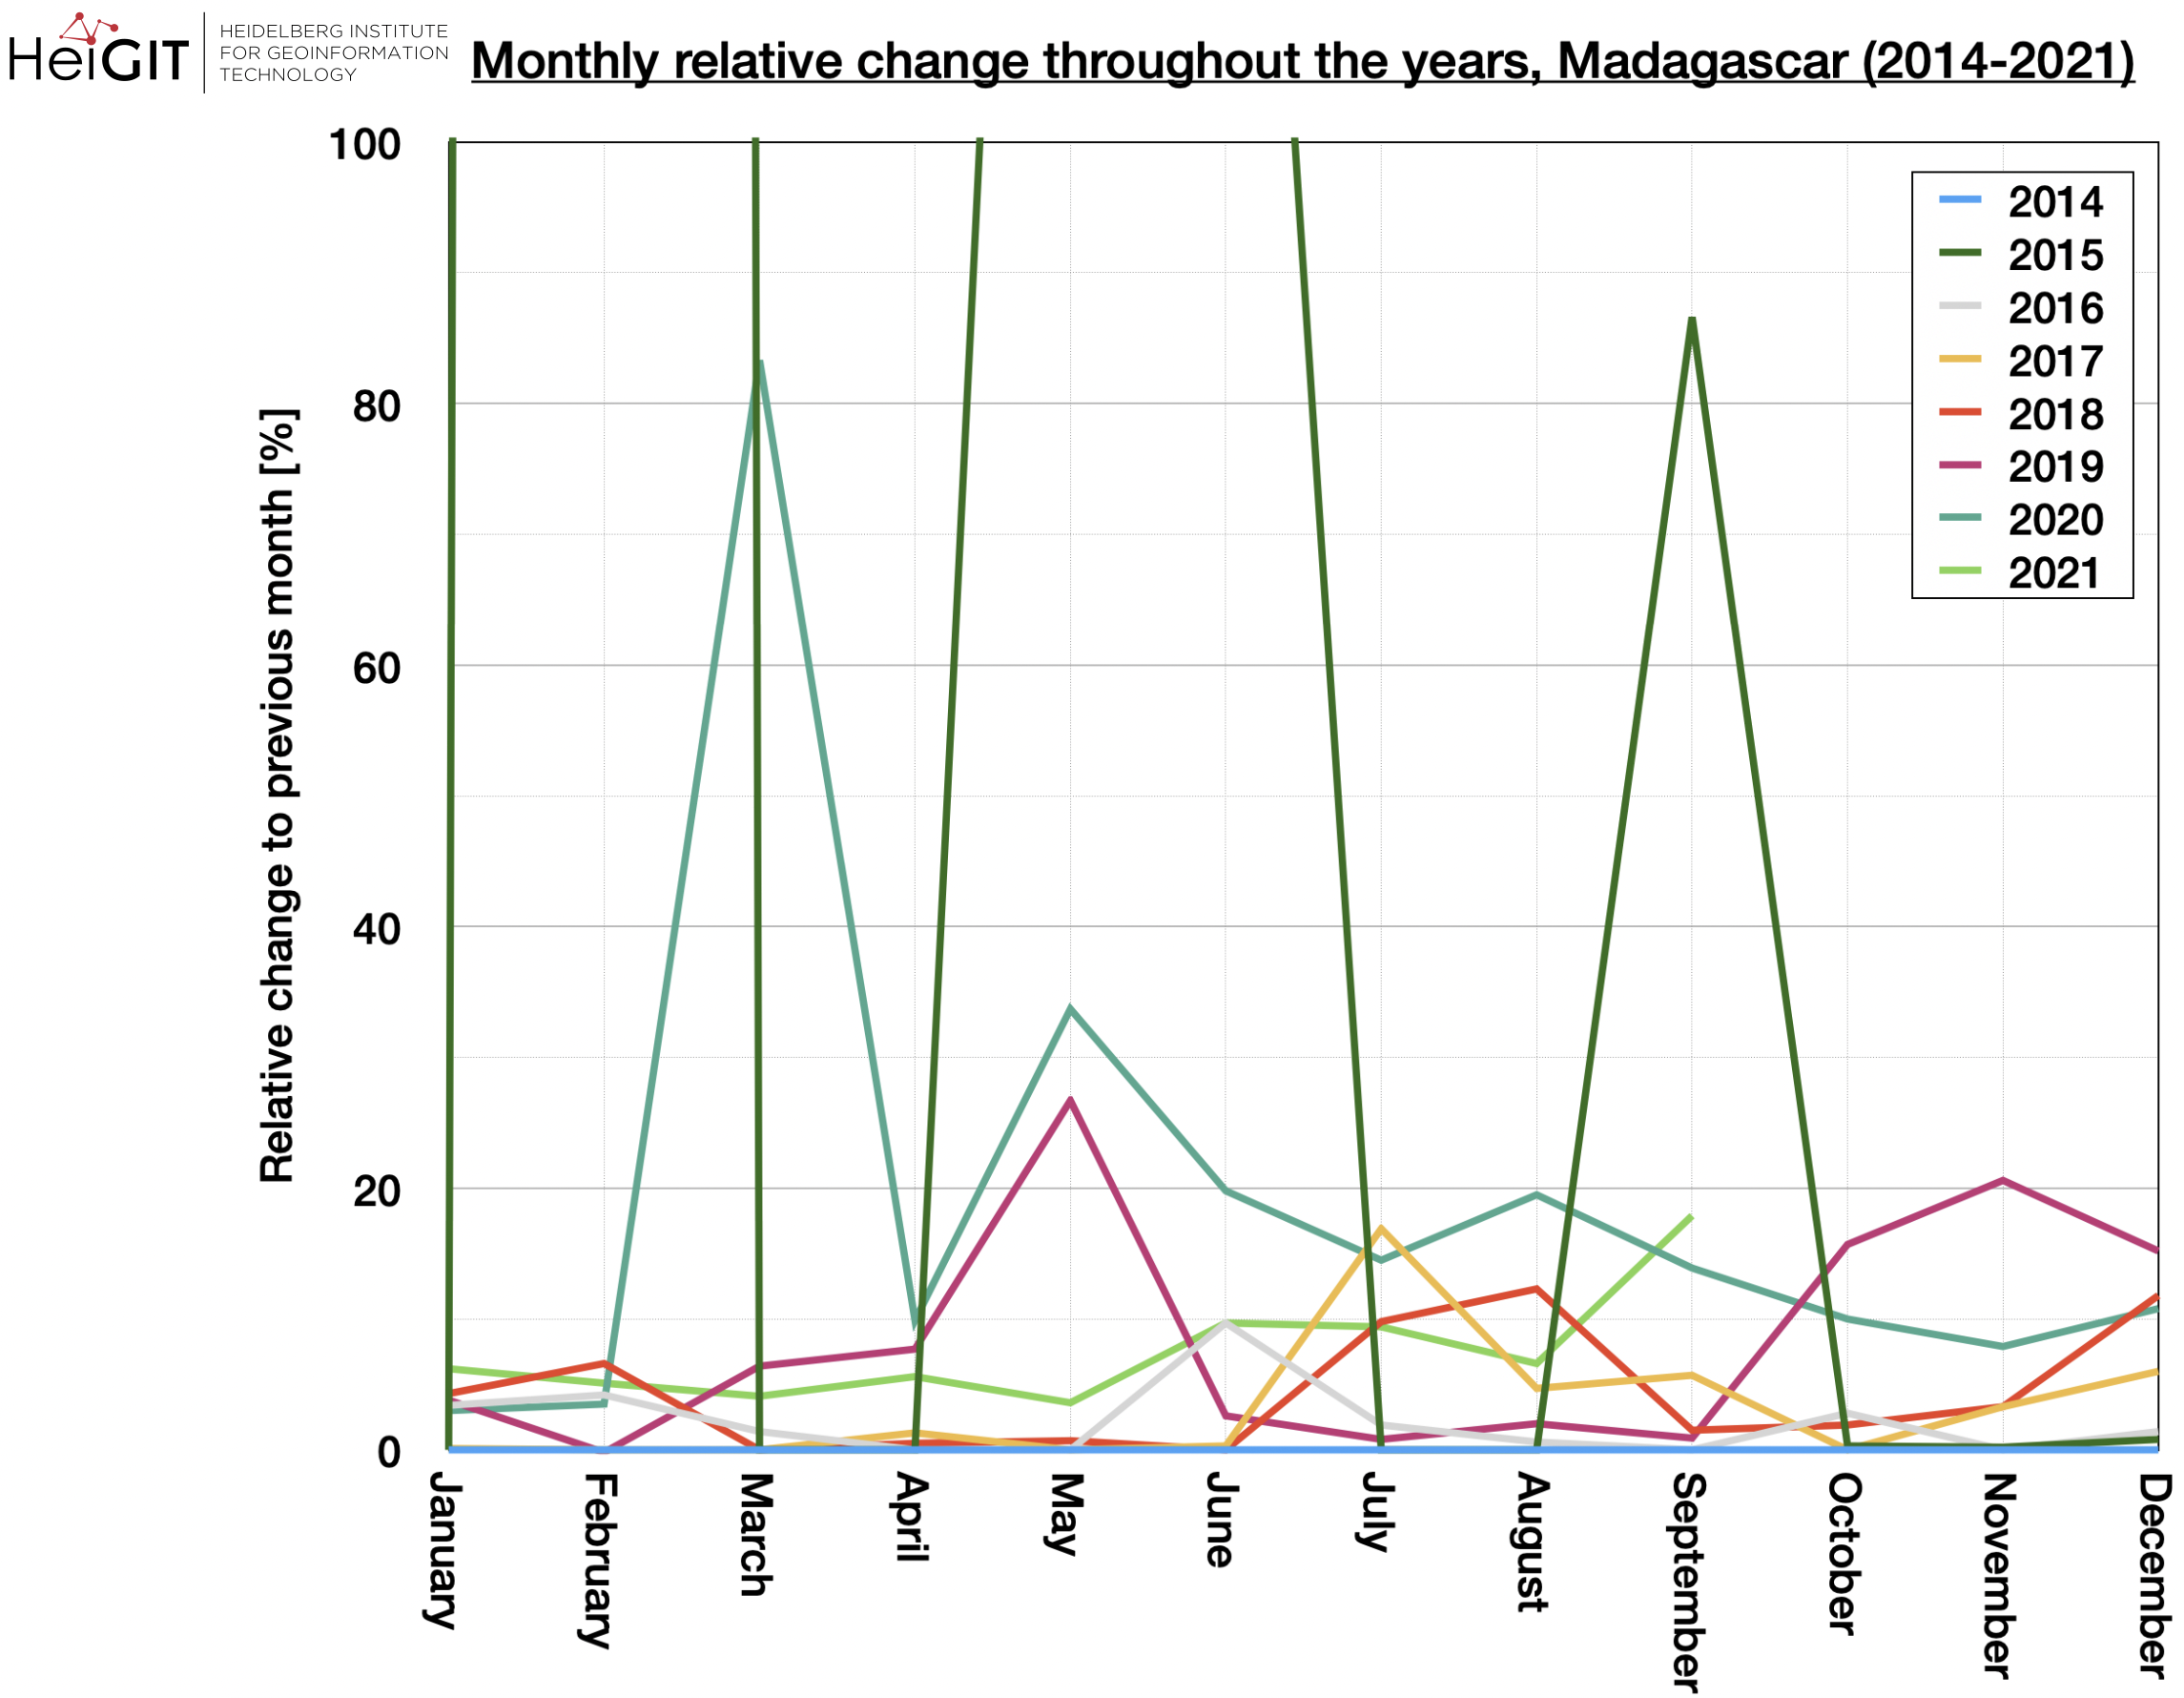
In the case of Madagascar, there is a continuous increase without any particular jumps in data. While the increase was rather moderate up to and including 2019, it has a much stronger increase in the last two years, especially from about February 2020.
Particularly high relative changes are found in Madagascar in 2015, for example, with special February, May to June and September standing out clearly. During 2019, there is also a high relative change with strong changes especially between February and June or between September and December. That activity continues into the following year with a peak in March and high activity throughout the year. In 2021, the relative change is much less pronounced, but a certain increasing trend can still be identified.
As there is generally a high tagging activity one cannot make out a seasonal trend in the tagging behaviour.
South Africa
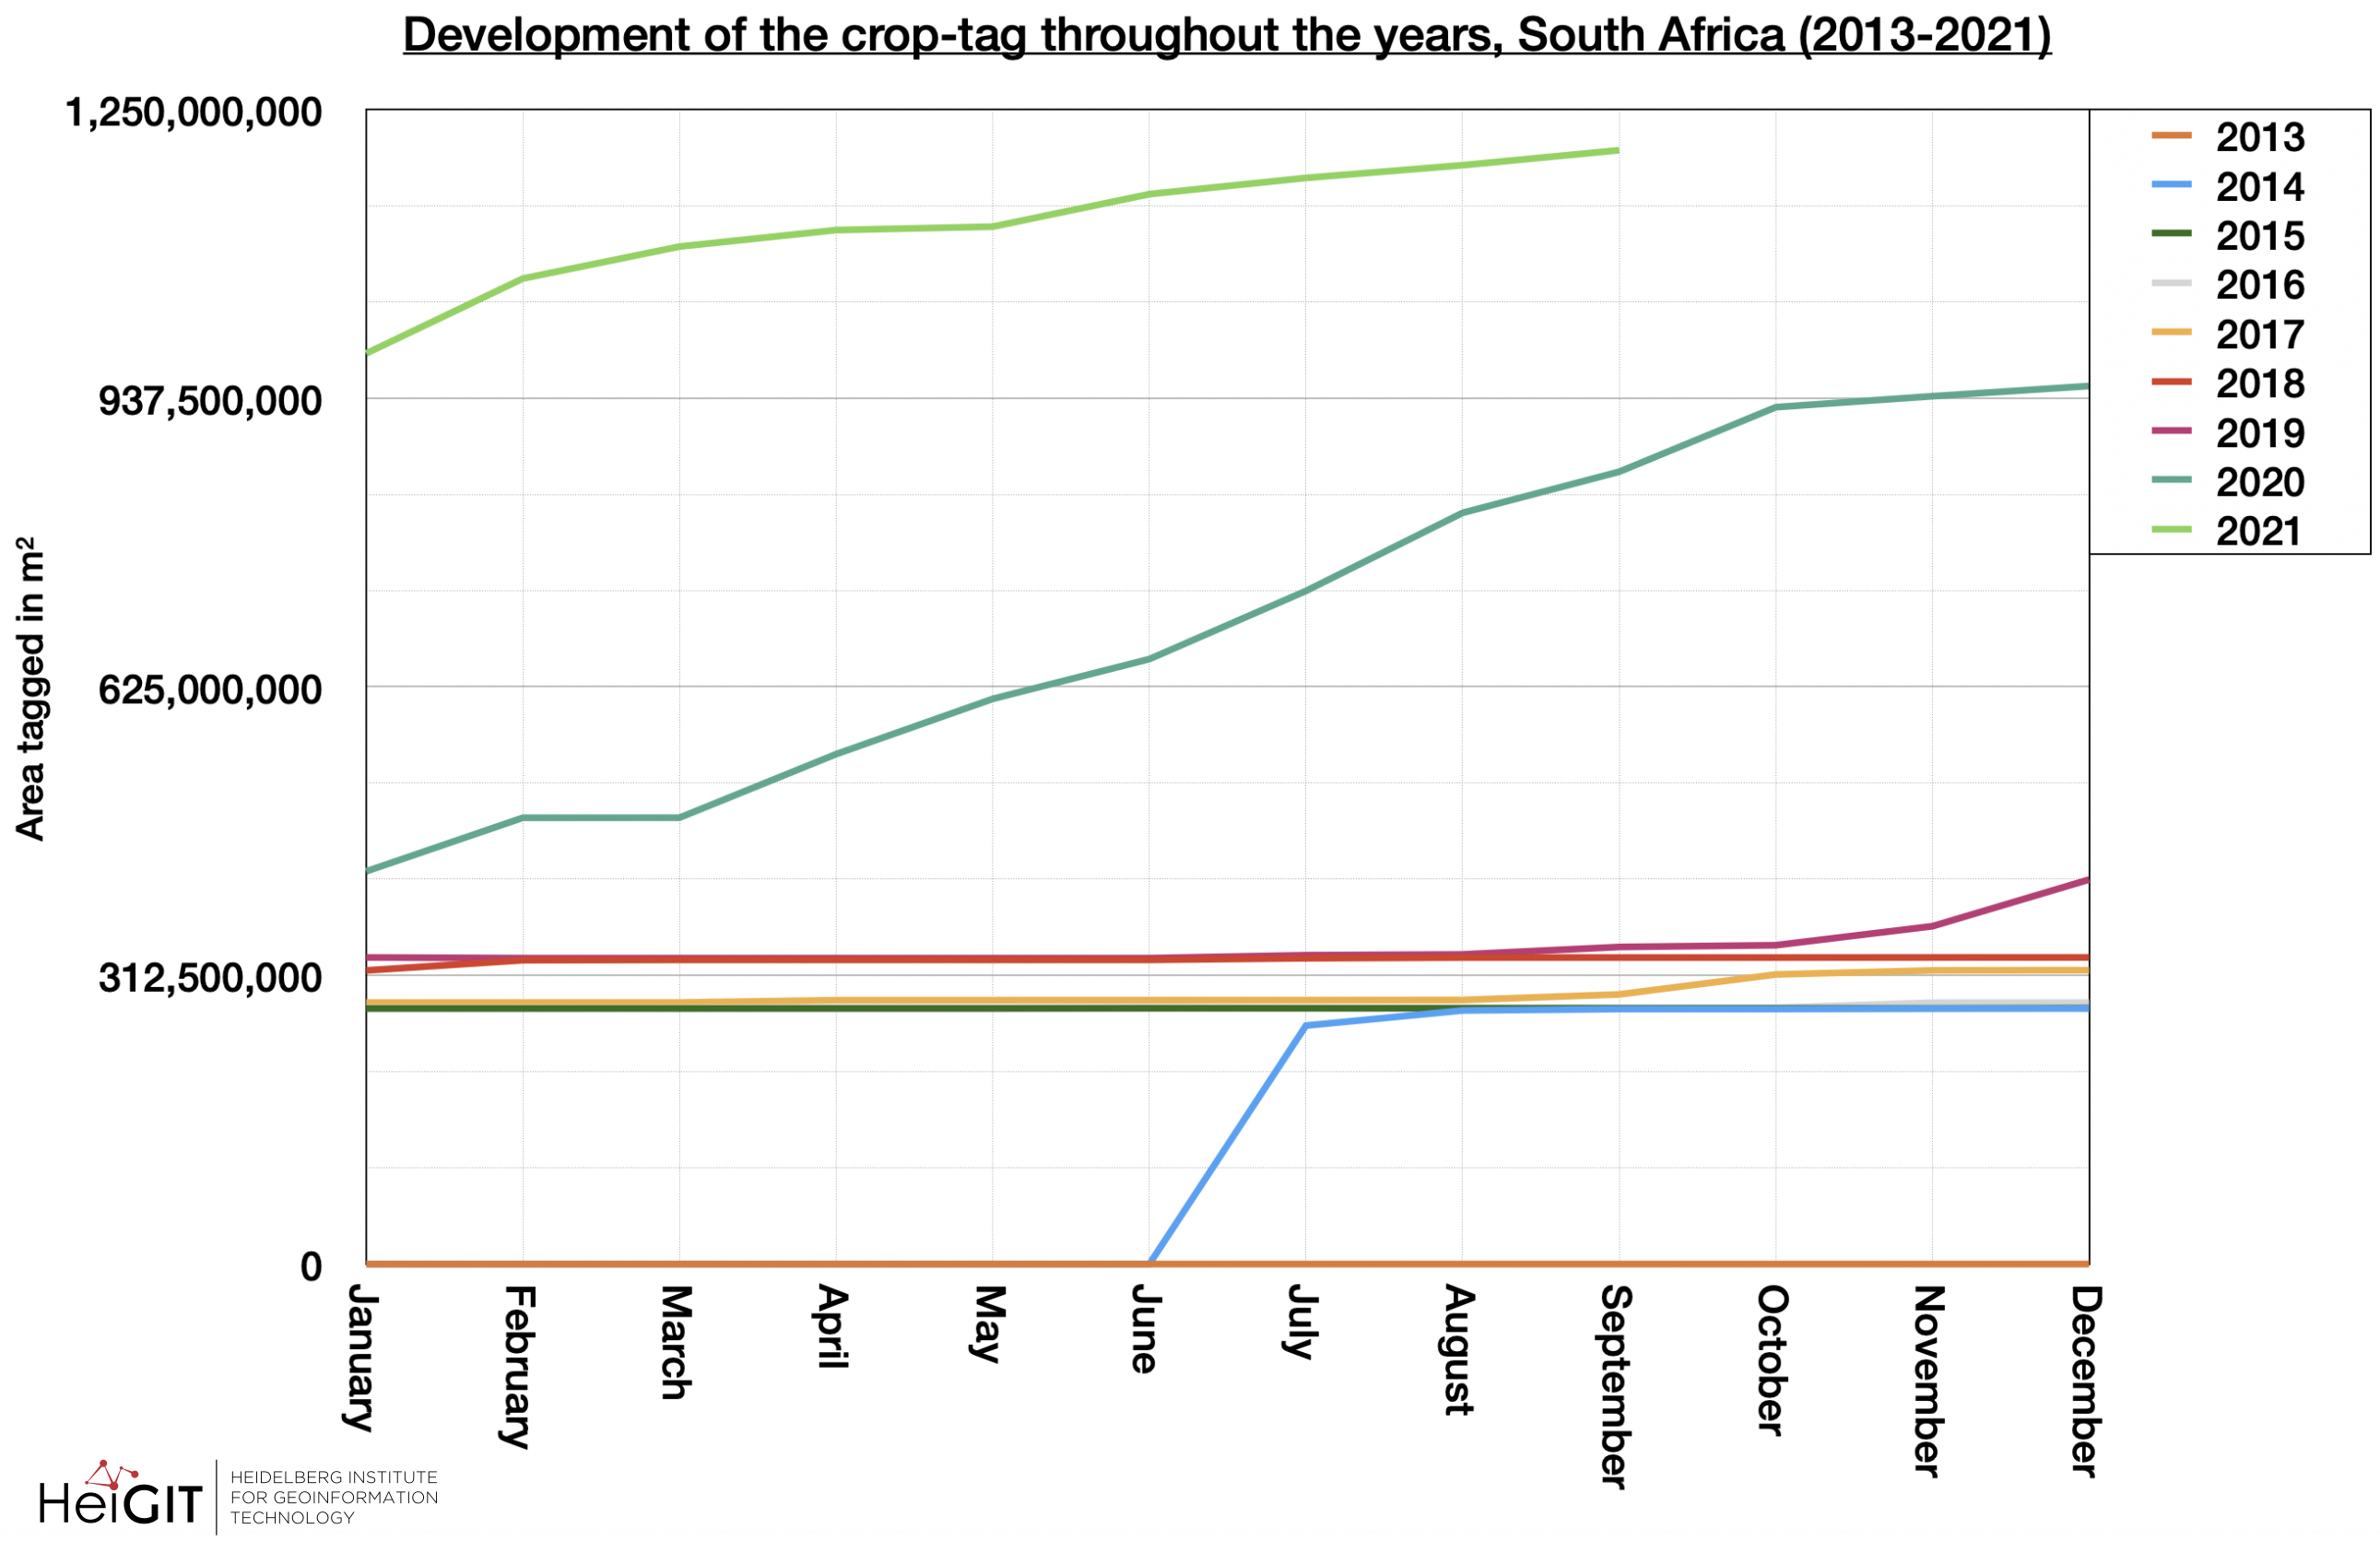

The crop tag has been present within South Africa since around July 2014 and undergoes only minor changes until around November 2019. In this region, the last two years in particular stand out due to an enormous increase in tagged crop-area, too.
When looking at the relative changes in the crop tag for South Africa, the period between June and August 2014 stands out in particular. This is probably again an import. However, no hint for a one time or ongoing import for this region could be found. As a result, there are only minor changes in the values and no change ≥20% is achieved anymore. By the end of 2019, starting in October, there are higher change values again which proceed throughout most of 2020 and end in a once more decreasing trend in 2021.
When looking for seasonal trends there are no certain months with unusually high tagging.
Spain

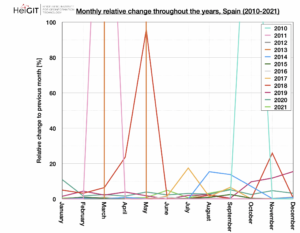
The crop tag has been present in Spain since around April 2013 and can only show slight increases until around March 2018. Between April and May 2018, there is a first stronger increase and over the month of October, such an increase occurs again. Within the last three years, the most dramatic changes can be followed.
In terms of relative change, there are very strong variations in values, especially in the earlier years, but these are probably due to imports.These include September to November in 2010, February to April in 2011, and March to May in 2013. In addition, there was a large increase in values in 2018 between January and June and October and December. The year before also showed slightly higher relative changes in July and September, but both were below 20%. The years 2020 and 2021 show relatively low change values, although these are usually the highest absolute values that distance themselves from the rest.
No seasonality could be found in the tagging behaviour for Spain either. More sudden changes, that might have been related to imports, were examined again. There have been first efforts to import Corine Landcover information for Spain. However, no years were noted, apart from it having begun in 2011, and no direct connection to the crop tag could be found. Furthermore, there is the CDAU Import that has been actively taking place since 2018, which could presumably have contributed to the overall slightly higher numbers ever since, but that is not certain. Generally, there are a lot of ongoing imports that might contribute to the development of the crop tag yet no one time imports could be found which would have been able to explain sudden changes.
Thanks for reading this newest addition to our ohsome Region of the Month blog post series! Stay tuned for more content to get you inspired to use the ohsome API for different use cases.
Until next time!
Background info: the aim of the ohsome OpenStreetMap History Data Analytics Platform is to make OpenStreetMap’s full-history data more easily accessible for various kinds of OSM data analytics tasks, such as data quality analysis, on a regional, country-wide, or global scale. The ohsome API is one of its components, providing free and easy access to some of the functionalities of the ohsome platform via HTTP requests. Some intro can be found here:
- ohsome general idea
- ohsome general architecture
- how to become ohsome blog series
- how spatial joins queries work in the OpenStreetMap History Database OSHDB