

Welcome back to the ohsome region of the month format where you can learn and get inspiration about potential applications of the ohsome API. This time we looked at forest-related information in four different Canadian regions looking for the green region of the month, which means there will be a winner announced at the end of this blog post. This time, the analysis will be done via jupyter notebook which you can find here and which also contains the used python code and more graphs and textual descriptions. This is not our first ohsome jupyter notebook blog post though, for example you could take a look at this one about the cycleways in the city of Heidelberg.
Data & Requests
As always you can get a GeoJSON with region boundaries here. This time the requests are quite similar to the ones sent in the ohsome street network analysis. For this months analysis, we looked at two different endpoints: endpoint -> /elements/area/density/groupBy/boundary & endpoint -> /users/groupBy/boundary for the time from January 2008 until February 2021 (with monthly values). For the analysis we used the following filter: (landuse=forest or nature=wood) and geometry:polygon.
Analysis
Density
The analysis can be split into two parts of which the first will be dealing with the development of the density values in m2/km2 throughout the years.
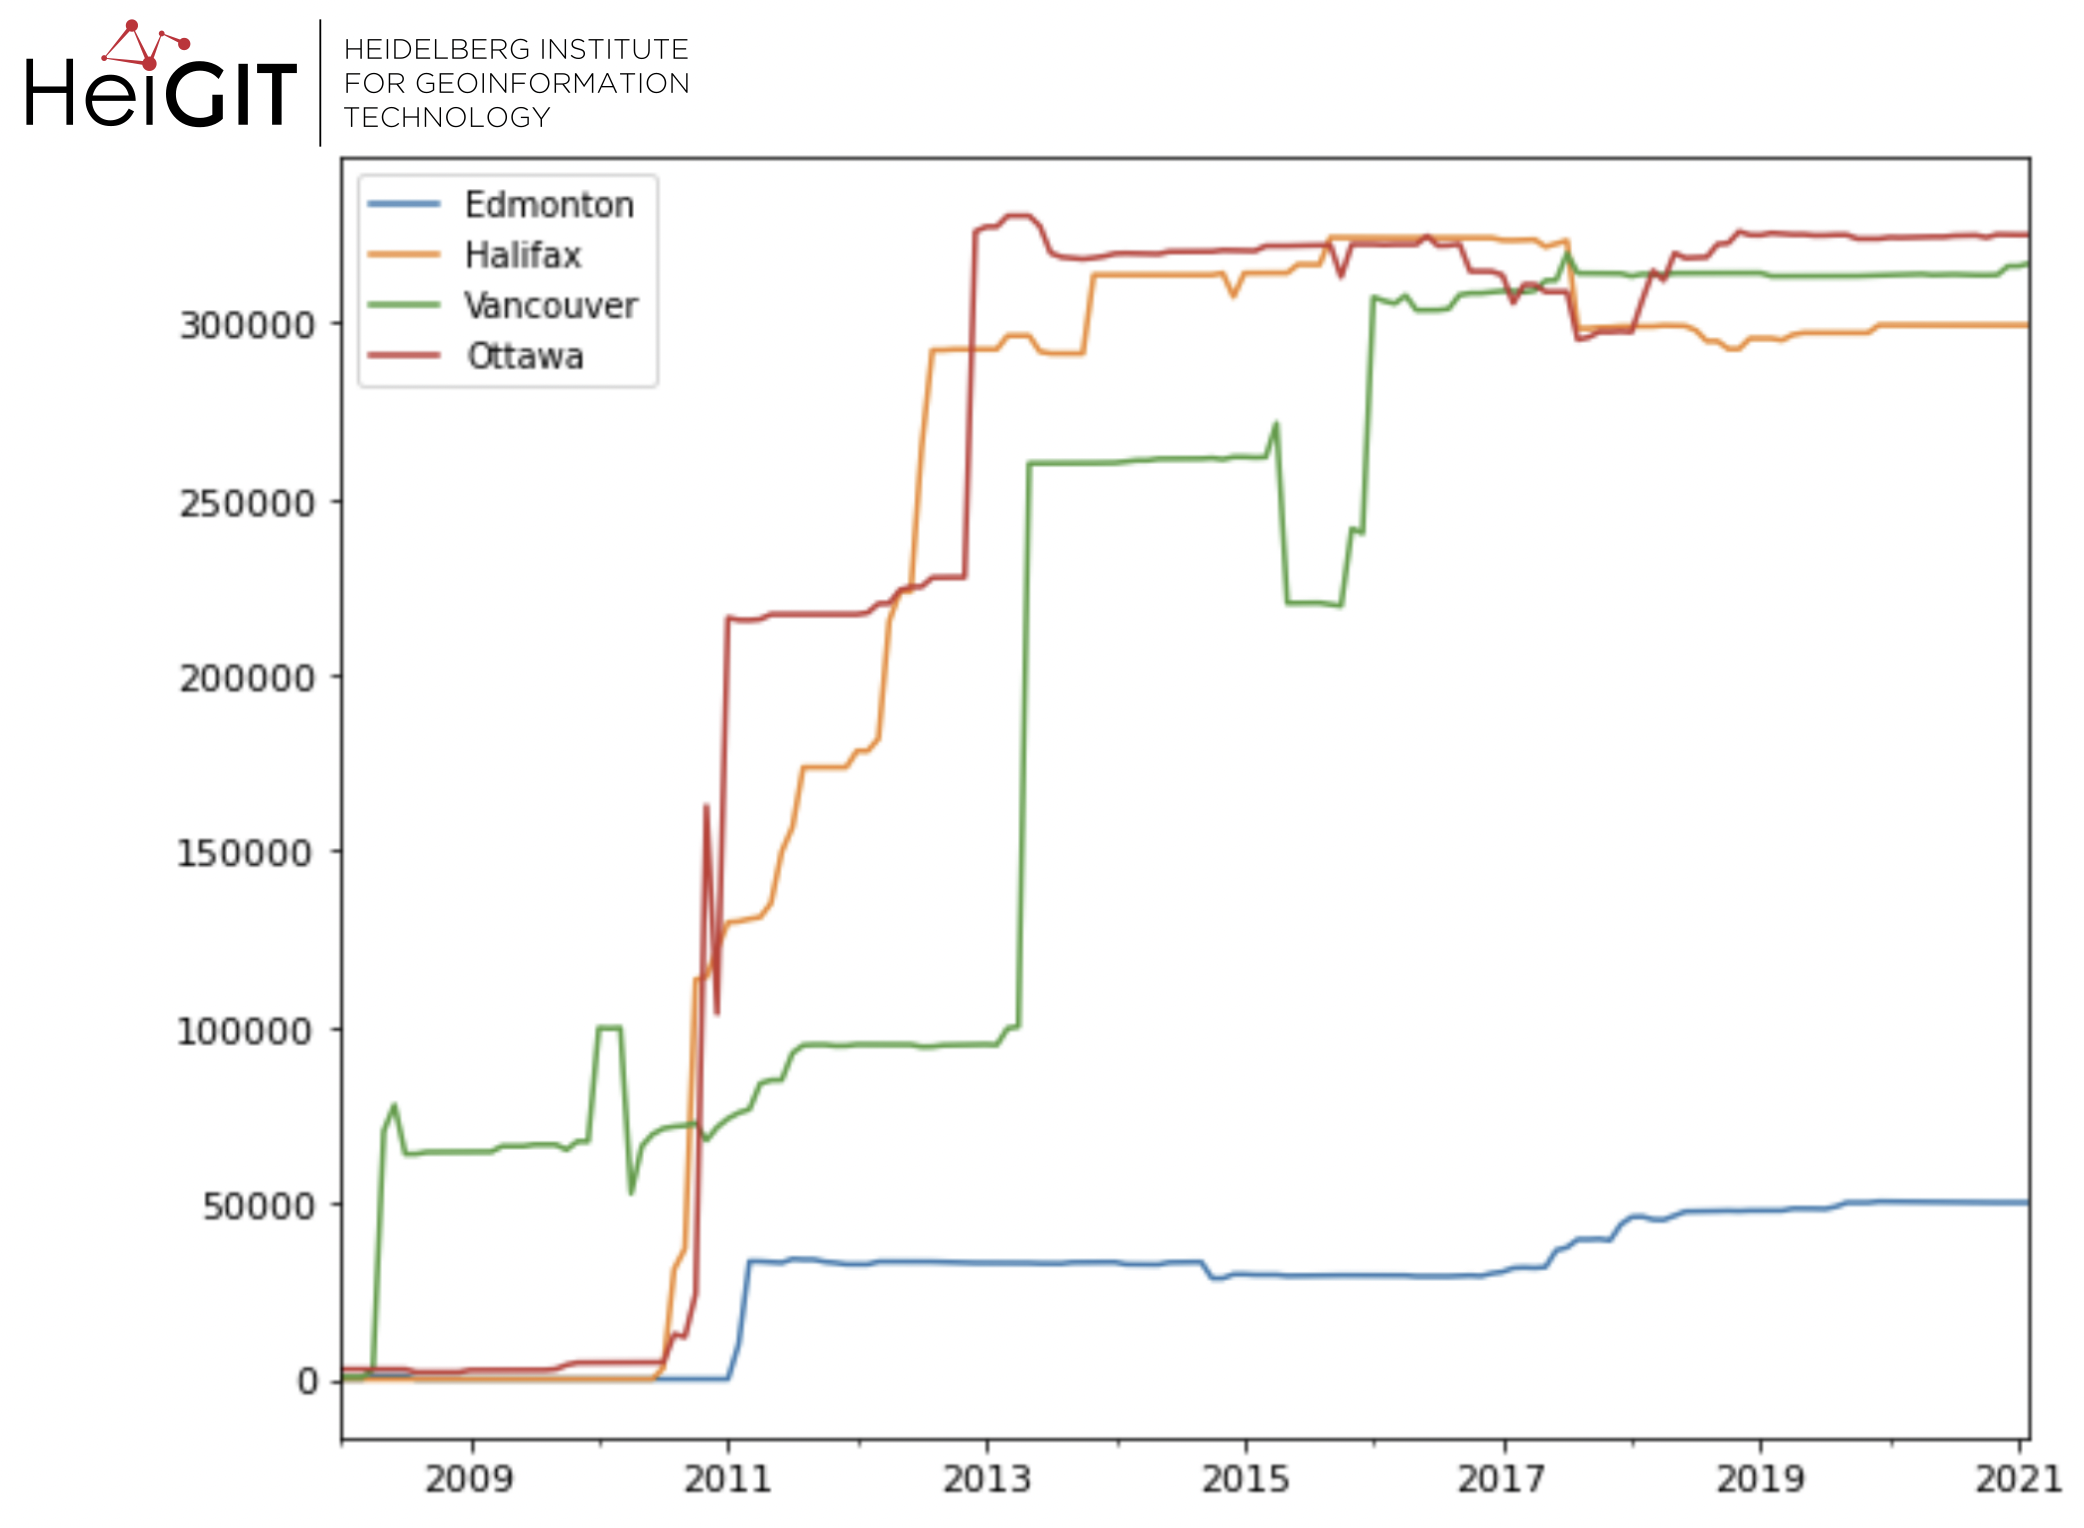
As you can see in the graphic above, Edmonton had the lowest values over the whole timespan which might be related to lower user-counts or overall low forest-density in real life. All other regions develop rather high density values over time although Vancouver shows the earliest increase in density and another rather strong jump in early 2013, around the same time as a Hackathon took place, but also quite a few collapses over time. Density-wise Ottawa is the winner looking at the overall development of density throughout the years as Halifax never manages to gain higher values than Ottawa for a very long time. For much more detailed information take a look at the notebook!
Density Ranking:
- Ottawa
- Vancouver
- Halifax
- Edmonton
User Count
In the second part of this months analysis we’ll take a look a the number of active users (per month) over the years 2008-2021.
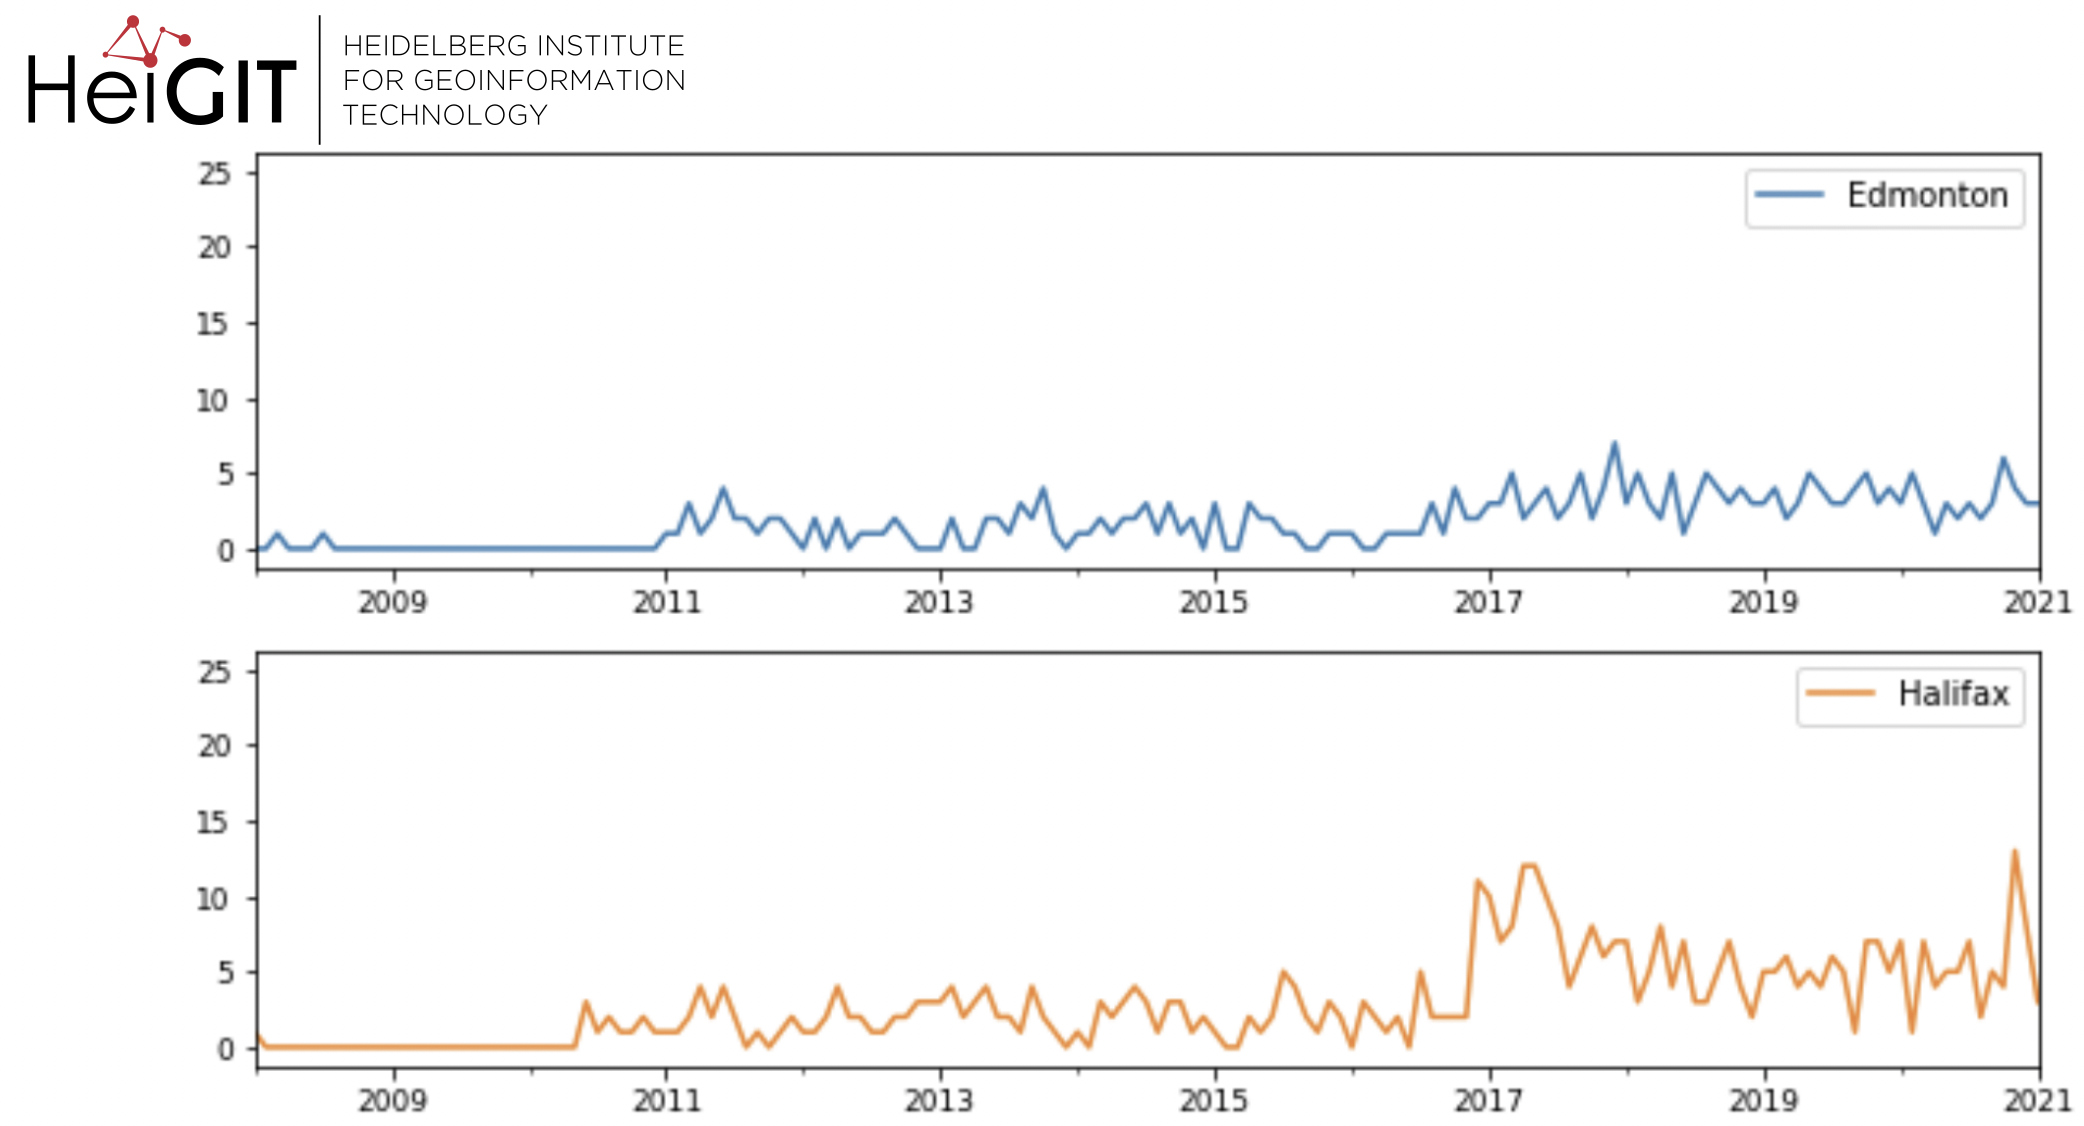
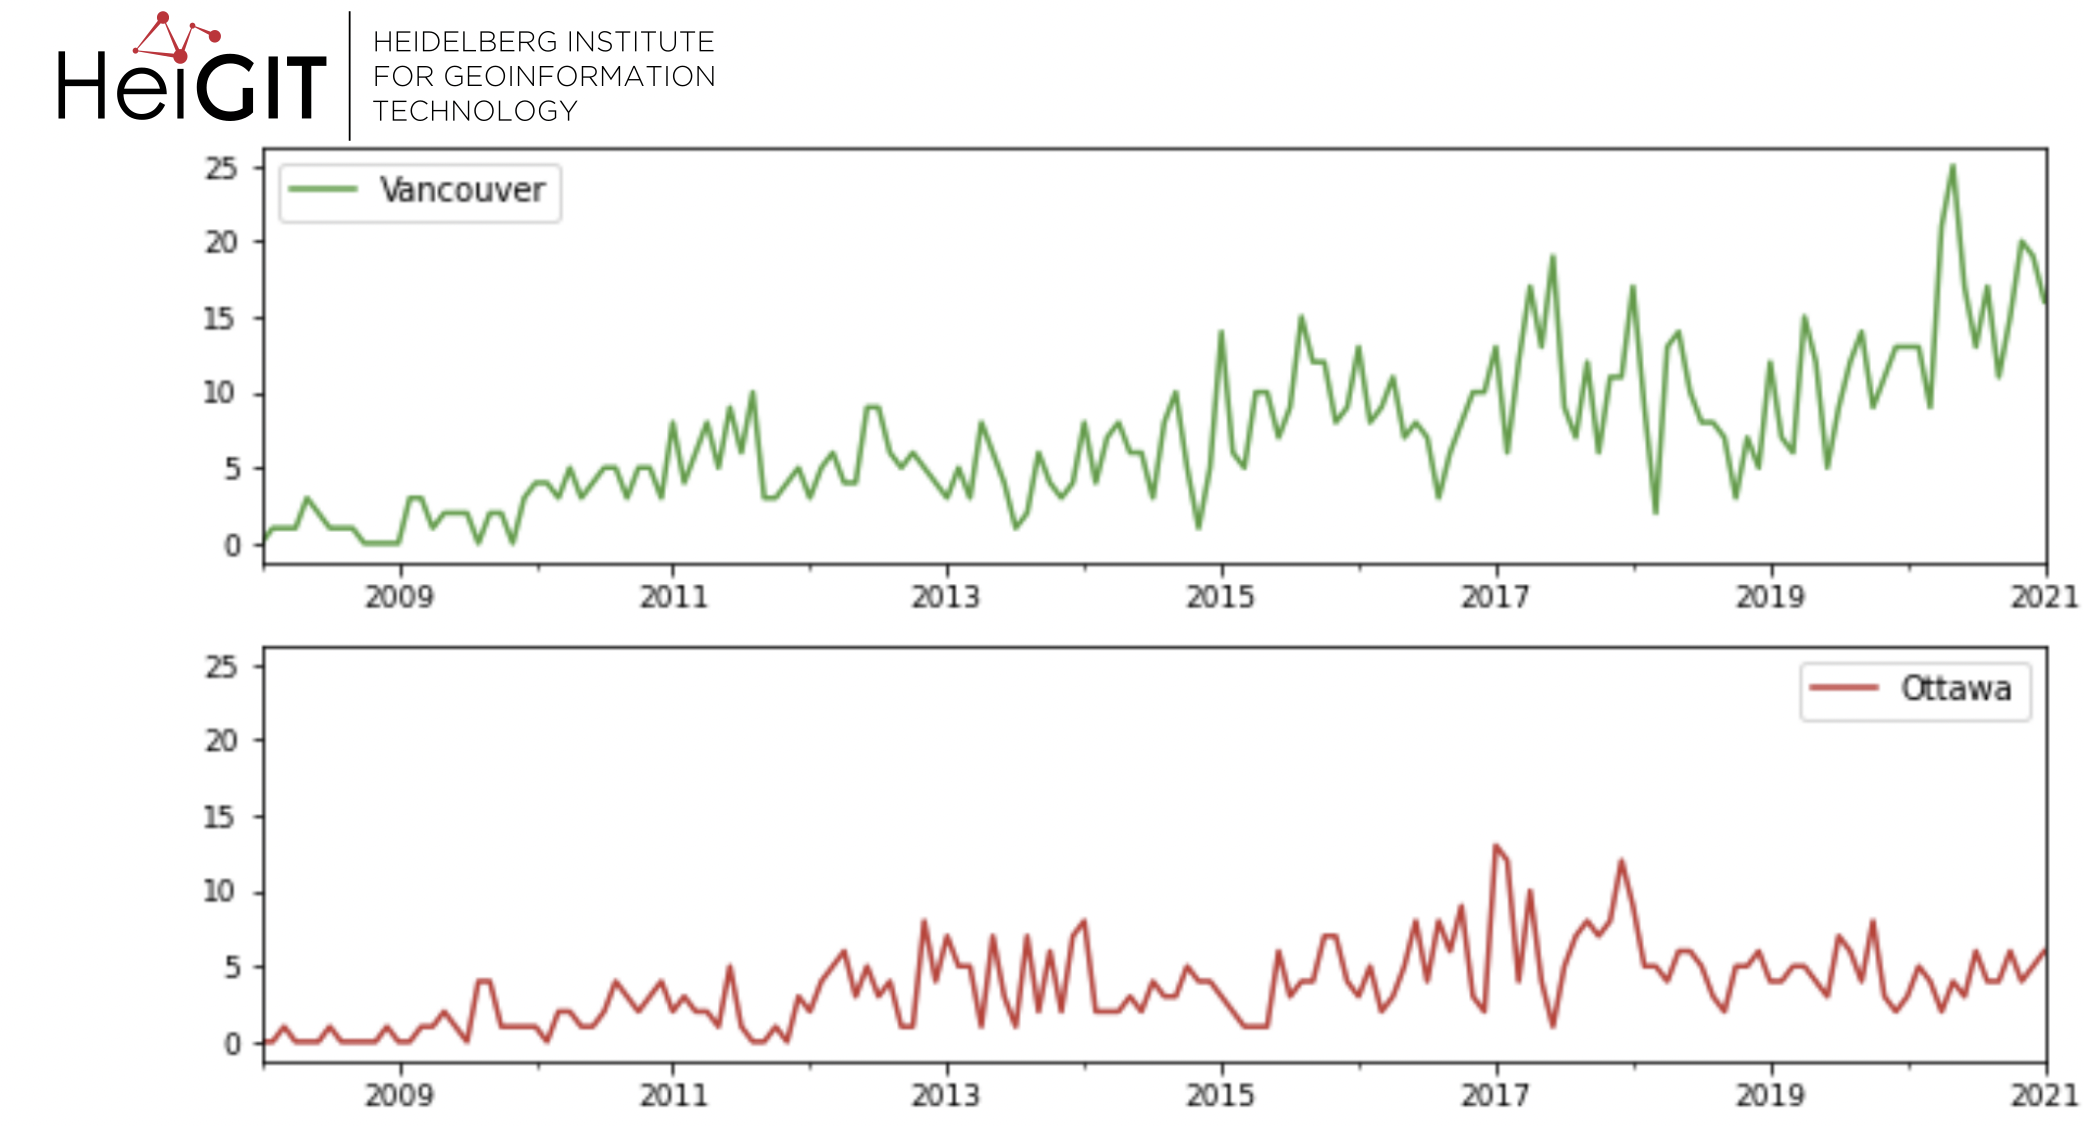
In the graphics above you can see the user numbers of the natural=wood as well as landuse=forest tag over the years.
For the second request, Edmonton has once more the lowest values which could indicate that for this region low density values might be connected to an overall lower mapping activity. Halifax and Ottawa have about similar numbers although those of Halifax appear to be a little steadier. Vancouver shows the highest peak values as well as an observable positive trend.
User Count Ranking:
- Vancouver
- Ottawa
- Halifax
- Edmonton
Final Ranking:
Since both Vancouver & Ottawa made it to the top in one of the rankings it appears to be useful to announce 2 winners this time: Vancouver in terms of user counts and Ottawa in terms of overall density development.
This leaves us with following ranking:
- Vancouver & Ottawa
- Halifax
- Edmonton
Thanks for reading the newest ohsome region of the month, stay tuned as there will be more blog posts in the future! As always, you can reach out to us via our email address ohsome(at)heigit(dot)org.
Background info: the aim of the ohsome OpenStreetMap History Data Analytics Platform is to make OpenStreetMap’s full-history data more easily accessible for various kinds of OSM data analytics tasks, such as data quality analysis, on a regional, country-wide, or global scale. The ohsome API is one of its components, providing free and easy access to some of the functionalities of the ohsome platform via HTTP requests. Some intro can be found here:
- ohsome general idea
- ohsome general architecture
- how to become ohsome blog series
- how spatial joins queries work in the OpenStreetMap History Database OSHDB