

Last November, we covered the recent increase of healthcare related objects in OpenStreetMap (OSM) in India. In less than a year, the amount of facilities has increased from 6.956 to 48.101. This is mainly due to an import run by RMSI – an Indian GIS consulting company. In this blog we will take a closer look at attributes that provide further information on the type of healthcare facility and services offered.
Increase of healthcare related OSM objects over time
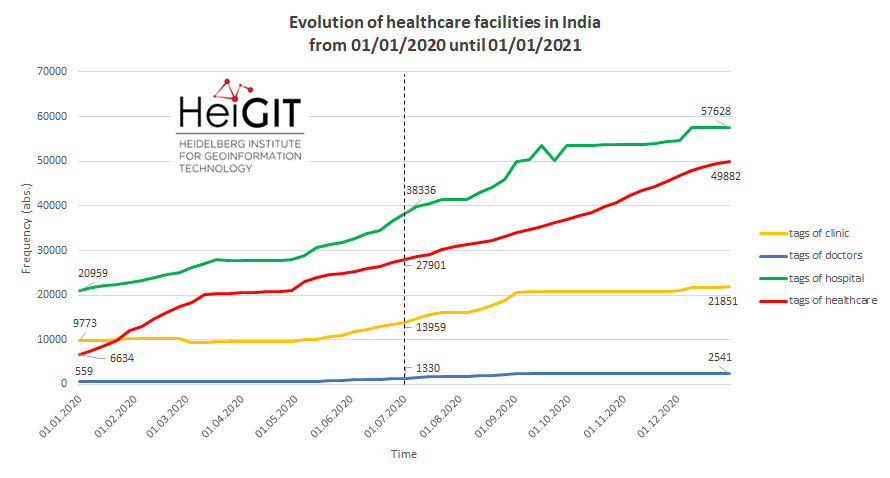
Fig. 1: Amount of healthcare related keys over the year 2020.
First of all, we note that the second half of 2020 saw a further strong increase in the amount of facilities. It has more than doubled. From 48.101 at the beginning of July to 123.073 in January 2021. All four tags that identify healthcare facilities show a growth of more than 50%. Healthcare (78%) and doctors (91%) even clearly exceed this level. The keys clinic and doctors have plateaued over the past four months. However, looking at the growth of the keys healthcare and hospital, especially over the last few months, it seems that the import process may not yet complete. How the share of the other keys will develop in comparison to the hospital key remains open. Currently, the hospital key accounts for almost half of all facilities, a highly questionable ratio.
Frequency of tags
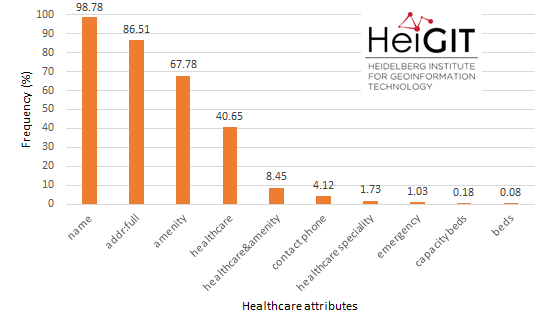
Fig. 2: Relative frequency for selected attributes in healthcare related OSM Objects (n=123.073).
This time, we do not stop at analyzing the changes in the amount of facilities over time. Rather, we look at the occurrence of attributes of the facilities. Attributes that allow for assessing the type of facility and available capacity are of particular interest. We start by calculating the frequency of every available attribute for our 123.073 facilities in India. The most common attribute is name (98%, see figure 1). The second most frequent attribute is addr:full. The name attribute can provide useful information in order to identify a facility beyond the amenity and healthcare tags. The addr:full attribute however, is mostly interesting for geocoding applications. The next most frequent attributes are already amenity and healthcare. Both attributes can occur for the same object. This is the case for 8.45% of all facilities. With these two tags we also already undercut the 50% frequency, meaning that less than half of all healthcare related facilities do bear more than three tags. Important tags are rarely tagged. For example, the bed (0.08) attribute, which provides information on the inpatient care capacity of facilities. The emergency (1.03%) tag is another example that provides information about the presence of emergency care. Also rarely tagged is the key healthcare:speciality. The second part of the blog is dedicated to this key.
Frequency of healthcare:speciality values
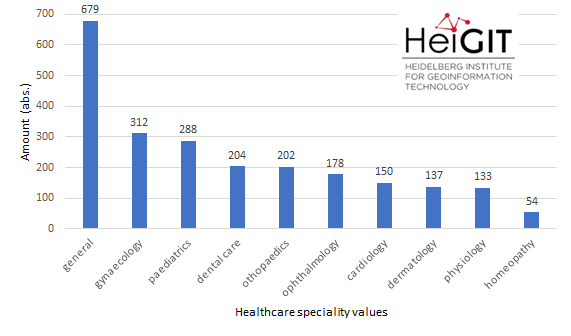
Fig. 3: Absolute frequency of the 10 most common values for the key healthcare:speciality
The key healthcare:speciality was introduced with the healthcare tag back in 2010. It was established to capture information on available medical specializations. From these specializations, eventually existing diagnostic/therapeutic capacities can be derived. The case that a facility has several specializations is represented by the multiple values scheme. Different values for the same key are separated by “;”. We extracted every value and ordered them by frequency (see fig. 3). Due to different spellings and typos, we also manually grouped some values. We found that “general”, “gynaecology”, “paediatric” and “dental care” were the four most frequent speciality values mapped in India. Where “general” is the most common value, with more than three times as many occurrences than the second most common value.
Distribution of healthcare:speciality values
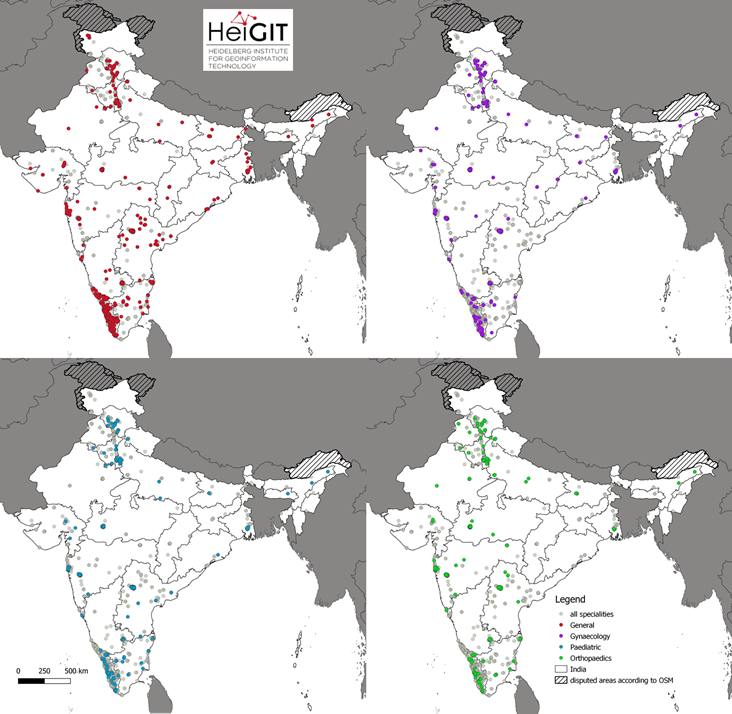
Fig. 4: Facet map of the distribution of the four most common values for the key healthcare:speciality
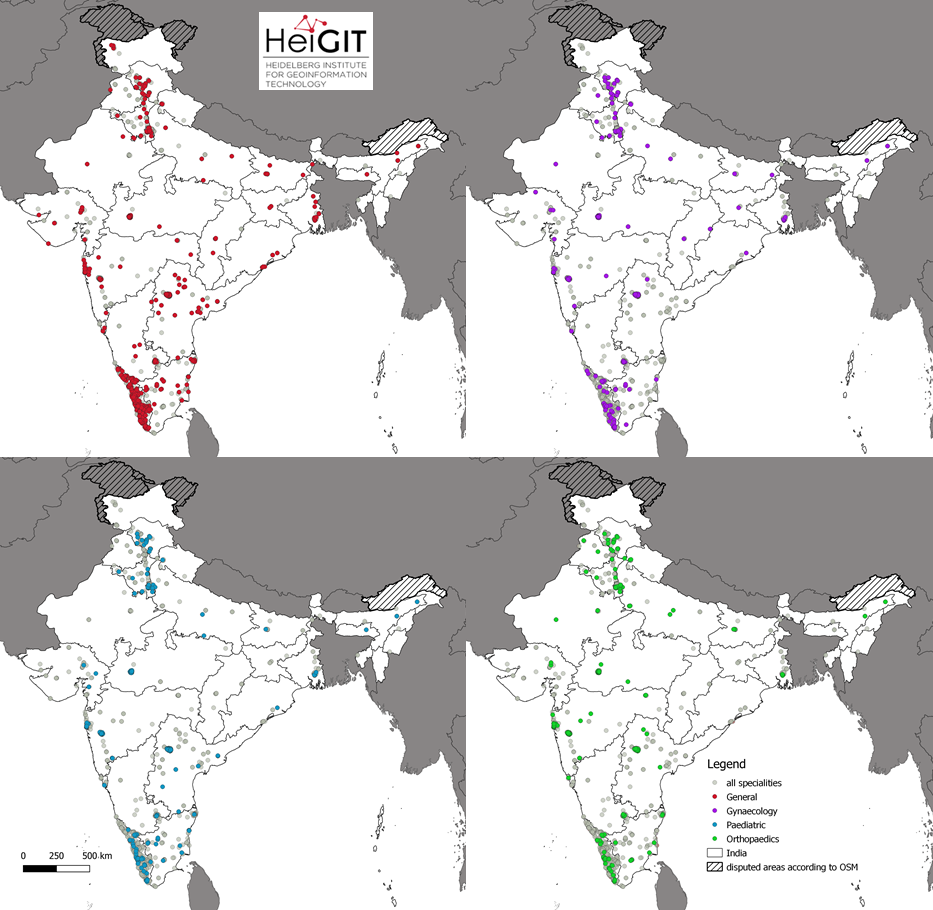
The four most frequent speciality values are further investigated with regard to their spatial distribution in India (see fig. 4). Four facet maps are shown, each for one of the values. The values are spread all over India, but with varying densities. These spatial variations values are almost identical for each of the values. Large clusters are located in the South-West (Kerala state), West (Maharashtra state) and North-West (Haryana, Delhi, Himachal Pradesh states). The occurrence of specialized hospital facilities seems to correspond to urban centers within the named states (Delhi, Chandigarh, Mumbai, Hyderabad, Kochi). The most dominant clusters are spread over the almost entire state of Kerala as well as along the axis of Shimla-Chandigarh-Delhi-Karnal. States like Assam, Kashmir and Odisha are rather sparsely covered with specialized facilities. It remains open whether the clusters are due to an underlying process of locating specialized facilities in central places or whether they reflect the urban-rural divide within OSM.
Conclusion
Our descriptive analysis shows the import in India continues. Plenty of healthcare infrastructure data has been added. Though, for the vast majority of facilities critical information beyond the simple classification by the amenity tag is missing. The distribution of the few facilities with this information indicate a strong correlation with highly urban spaces. It cannot be determined what influence real world processes and bias in OSM have on this fact.
In a forthcoming analysis, we will broaden our scope of investigation. We will look at the distribution of healthcare facilities in OSM globally. How are they distributed and where are critical tags mapped and where not.
Related Literature and earlier work:
- Geldsetzer, P.; Reinmuth, M.; Ouma, P. O., Lautenbach, S.; Okiro E. A.; Bärnighausen, T.; Zipf, A. Mapping physical access to health care for older adults in sub-Saharan Africa and implications for the COVID-19 response: a cross-sectional analysis. The Lancet Healthy Longevity. 2020;1(1):e32-e42.
- Herfort, B., Lautenbach, S., Porto de Albuquerque, J., Anderson, J., Zipf, A.The evolution of humanitarian mapping within the OpenStreetMap community. Scientific Reports 11, 3037 (2021). DOI: 10.1038/s41598-021-82404-z https://www.nature.com/articles/s41598-021-82404-z
- Schott, M.; Grinberger, A.Y.; Lautenbach, S.; Zipf, A. The Impact of Community Happenings in OpenStreetMap—Establishing a Framework for Online Community Member Activity Analyses. ISPRS Int. J. Geo-Inf. 2021, 10, 164. https://doi.org/10.3390/ijgi10030164
- Auer, M.; Eckle, M.; Fendrich, S.; Griesbaum, L.; Kowatsch, F.; Marx, S.; Raifer, M.; Schott, M.; Troilo, R.; Zipf, A. (2018): Towards Using the Potential of OpenStreetMap History for Disaster Activation Monitoring. ISCRAM 2018. Rochester. NY. US.
- Scholz, S., Knight, P., Eckle, M., Marx, S., Zipf, A. (2018): Volunteered Geographic Information for Disaster Risk Reduction: The Missing Maps Approach and Its Potential within the Red Cross and Red Crescent Movement. Remote Sens., 10(8), 1239, doi:10.3390/rs10081239.Recent changes to OpenStreetMap healthcare infrastructure in India
- Raifer, Martin; Troilo, Rafael; Kowatsch, Fabian; Auer, Michael; Loos, Lukas; Marx, Sabrina; Przybill, Katharina; Fendrich, Sascha; Mocnik, Franz-Benjamin; Zipf, Alexander (2019): OSHDB: a framework for spatio-temporal analysis of OpenStreetMap history data. Open Geospatial Data, Software and Standards.
- Analysing OSM Completeness of health facilities in Sub-Sahara Africa in ohsomeHeX
- Exploring OSM for healthcare access analysis in Sub-Saharan Africa
- Accessibility to pharmacies in Germany with 15km Covid-19 restriction
- Accessibility of covid-19 vaccination centers in Germany
- Updated OSM Healthcare in Senegal (2020)
- Exploring OSM history: the example of health related amenities
- Mapping physical access to health care for older adults in sub-Saharan Africa and implications for the COVID-19 response: a cross-sectional analysis