

With the increasing availability of global disease datasets, Visual Analytics (VA) has emerged as a valuable tool in spatial epidemiology, particularly for studying serotype interactions in diseases like dengue. Dengue, caused by four serotypes (DENV1-DENV4), poses a significant global health threat exacerbated by urbanization and climate change. Traditional approaches rely on static mapping or animation of serotype incidence, but there remains a gap in utilizing VA tools for dynamic and interactive analysis of complex spatiotemporal patterns.
This paper introduces GeoDEN, a visual analytics tool designed to support epidemiological investigations into the spread and interaction of dengue serotypes worldwide. It unbales expects to analyze serotype movements across time and space through three linked visualizations, offering interactive selection, faceting, and animation capabilities. Through insight-based and value-driven evaluations, domain experts validated existing hypotheses and uncovered novel insights, highlighting the tool’s potential to inform vaccine development and intervention strategies.
Future enhancements to GeoDEN include integrating molecular epidemiology data, automating data extraction with large language models, and incorporating geospatial text visualization techniques. These advancements could further improve the tool’s analytical capabilities, aiding epidemiologists in understanding disease dynamics and supporting global public health efforts.
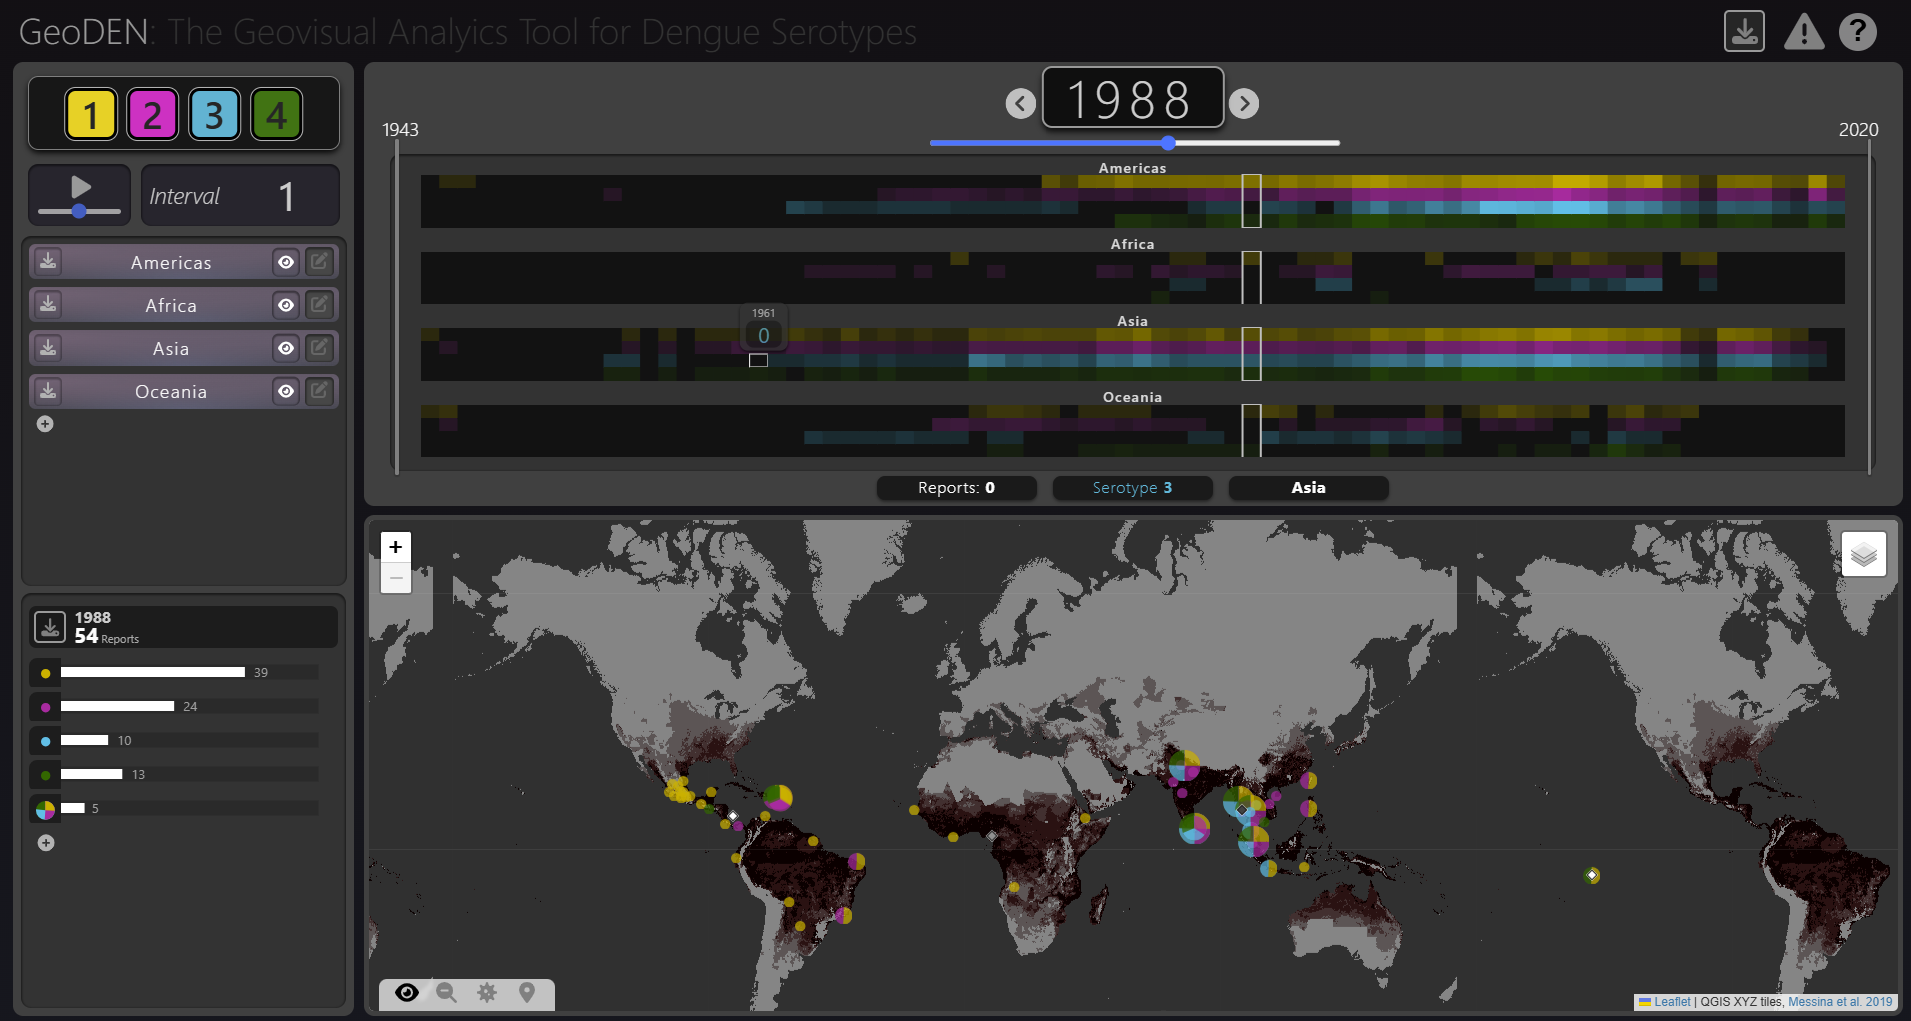
Title image: Screenshot of the GeoDEN – a visual analytics tool. A, Serotype Selection: choose active serotypes. B, Animation Controls: toggle and adjust animation speed. C, Interval Length Editor: modify number of years visualized. D, Region Faceting: define regions for visualization. E, Co-Occurrence Histogram: examine frequency of serotype co-occurrence. F, Year Editor: adjust the year. G, Heatmap Timeline: compare regions and serotypes over time. H, Map: view reports, centroids, trajectories, and environmental suitability.
Reference: Marler, A., Roell, Y., Knoblauch, S., Messina, J. P., Jaenisch, T., & Karimzadeh, M. (2025). GeoDEN: A visual exploration tool for analyzing the geographic spread of dengue serotypes. Computer Graphics Forum. GeoDEN: A Visual Exploration Tool for Analyzing the Geographic Spread of Dengue Serotypes
If you want to learn more about the spatio-temporal dynamics of emerging viruses, please visit the GeoEPI project page.