

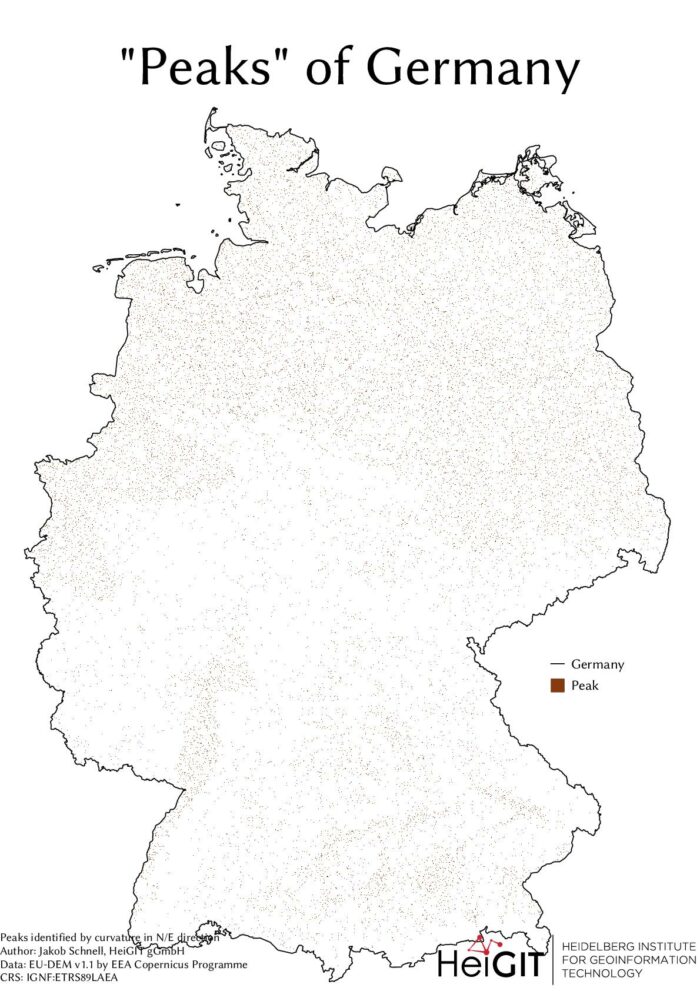
Featured Image: The peaks of Germany identified by curvature in N/E direction, Jakob Schnell’s contribution for Day 7 (Raster) of the #30DayMapChallenge.
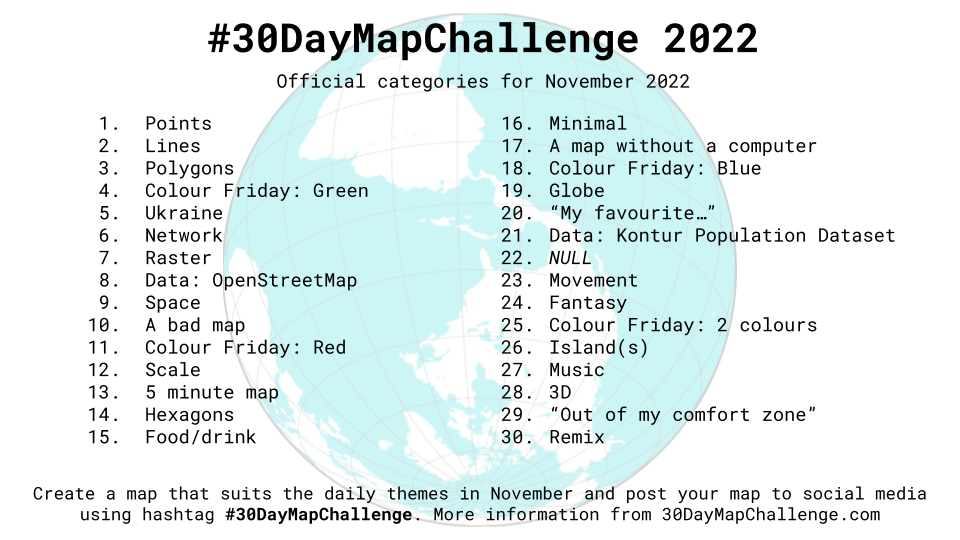
This past November, our teams at HeiGIT and GIScience participated in Topi Tjukanov’s Twitter event #30DayMapChallenge, where mappers display their creativity and ingenuity with a set of 30 daily prompts ranging from colors to specific datasets to geometric limitations in any sort of map one can imagine. The challenge runs for the entire month of November and has been active since 2019.
As we eagerly anticipate the next round of mapping, we’re looking back at our contributions to last year’s challenge. In this series, we’ll speak to some of the mappers to gain insight into the colorful, innovative, and downright stunning submissions from last November.
We begin our series with three wonderful entries from HeiGIT Research Associate Jakob Schnell, who works on the company’s Smart Mobility Team. For Day 7, Jakob contributed a map for the theme Raster, or a day dedicated to those lovely pixels. Raster data is defined as consisting “of a matrix of cells (or pixels) organized into rows and columns (or a grid) where each cell contains a value representing information, such as temperature” according to ArcGIS. Jakob’s raster map shows the peaks of Germany identified by curvature in both the north and east direction. The map is displayed at the top of the page as this post’s featured image.
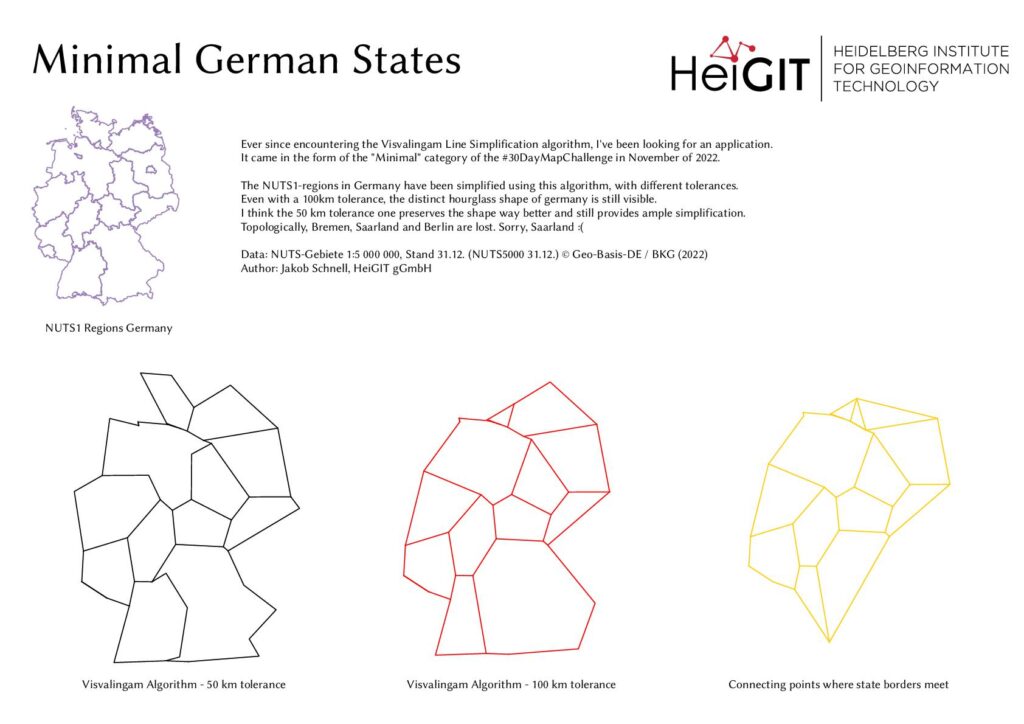
Jakob’s next map came on day 16 for the theme Minimal, described as How minimal can you go? Jakob evidently rose to the challenge with outlines that would please even the most devoted Mondrian fan using the Visvalingam Line Simplification algorithm. Employing three tolerance levels, the maps manage to maintain a mostly-identifiable Germany outline, though we unfortunately must say Tschuss to the Saarland, Bremen and Berlin region by the time we arrive at Germany’s final form.
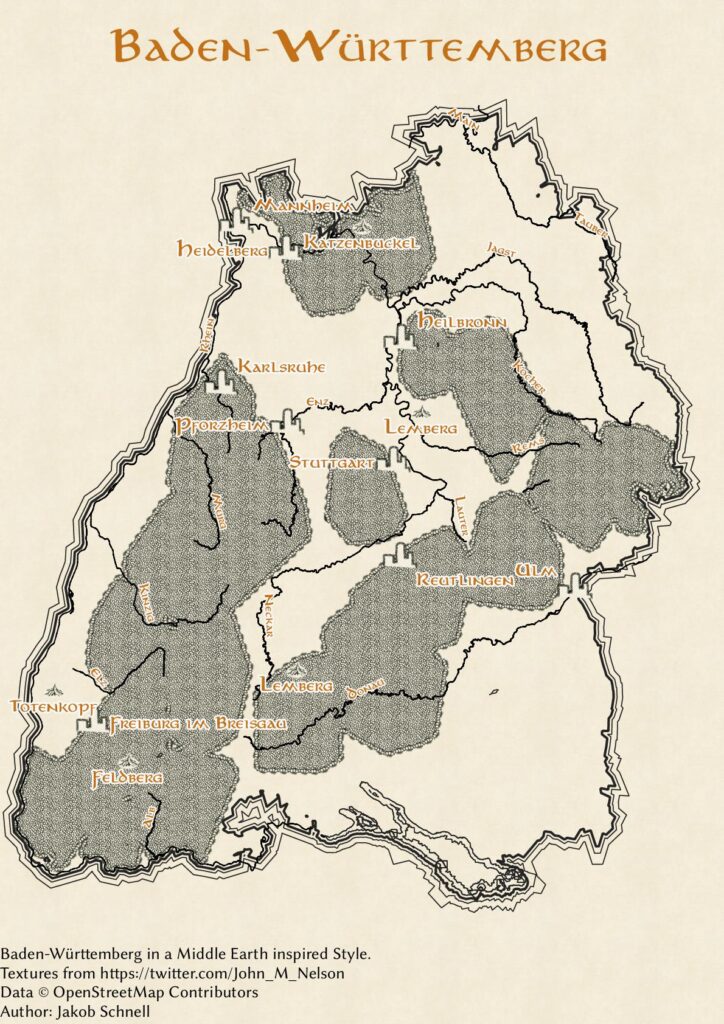
Finally, Jakob showed us that one does not simply map Mordor for Day 24 with the theme of Fantasy (An imaginary place or a fantasy style). Instead, one produces a detailed representation of the lands surrounding our headquarters in the German state of Baden-Württemberg complete with mountains, castles, and foreboding borders. Jakob’s submission presents the perfect map for quest-making, treasure-hunting, and online mapping challenges.
We asked Jakob about his motivation, technique, and his own journey to GIS research.
Can you introduce yourself?
My name is Jakob Schnell, I am part of the smart mobility team as a software developer and in user support. After school, I originally started out by studying physics but had to accept that that wasn’t for me – so I switched to maths and computer science in my master’s. During that time, I became fascinated with graphs and graph algorithms, but it was only after my thesis that I found the openrouteservice. Since I have been interested in maps privately for a long time, my current job now unites both my academic and my private fascination for the GIS-world.
What inspired your map?
From the get-go, it was clear to me that I wanted my maps to have some sort of regional focus, so I chose data from Germany and Baden-Württemberg. Inspiration for the _peaks_ map came from being fascinated with the concept of topographic isolation, and I figured I might use the “new” Copernicus DEM for something. It turns out that QGIS doesn’t have a method for topographic isolation, so I stuck to the next best thing I could find. Shortly before starting on the minimalism map, I stumbled across a beautiful illustration of the Visvalingam line simplification algorithm and liked it so much that I figured I had to do something with it. Inspiration for the LOTR-style map came from, well, the Lord of the Rings map – I love it and I wanted to see what I could hack together, given the map challenge time frame.
What should people take away from your map?
If anyone has a look at the Visvalingam algorithm, the Copernicus DEM, LOTR or QGIS from looking at my maps, I’d be more than happy. Apart from that, I feel that there’s not too much more to take away – except for maybe that participating in the 30DayMapChallenge isn’t that hard and more people should try it.
What does the future look like for your research and for this project?
I love seeing all the maps that people have created during this and the last year’s challenges, so I’ll definitely browse around and have a look at what people have done at some point(s). I don’t think I’ll further any work on the existing maps I’ve done, but I’m already looking forward to next year’s map challenge.
We’re also keen to see what eye-popping submissions Jakob Schnell cooks up for this year’s 30 Days Map Challenge. In the meantime, stay tuned for upcoming installments of our look back on 2022’s entries, with the next post focusing on a lengthy endeavor to explore the history of OpenStreetMap by visualizing deleted objects and subsequent entries honing in on Heidelberg and the world at large.