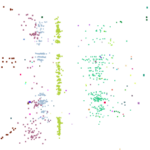
Not just LiDAR sensors, but also social media sources produce point clouds. We compiled two new visualisations showing spatiotemporal Twitter Tweet locations.
One of them is centered at Maracanã stadium during the football world cup 2014. The point cloud allows seeing various games that appear in the form of pronounced discs. In the centre of these discs, one can see “pillars” of Foursquare check-in data, which got additionally published via Twitter.
The second visualisation shows a residential area in Cambridge, Massachusetts. Each of the solid “stumps” represents one residential house of some Twitter user. It is quite easy to distinguish different kinds of user behaviour, just on a visual basis.
You can check out the visualisations here:
Maracanã stadium: http://bit.ly/1zV7PLJ
Residential Area in Cambridge, MA: http://bit.ly/1xLk5cd (Recommendation: Increase the point size to 2.0)


