Studies have long assessed people’s accessibility to amenities through public transportation, typically using General Transit Feed Specification (GTFS) data. GTFS reflects planned transportation schedules, detailing the intended services and routes of transit systems. However, this approach raises an important question: are we missing critical insights by not incorporating real-time information?
A recent study led by Alessandro Nalin, a researcher at the DICAM Department (and a visiting PhD student at GIScience at the time of this research), University of Bologna, in collaboration with GIScience and HeiGIT members, explores this gap. The research focused on Bologna, Italy, analyzing the Gini index of accessibility metrics to amenities using a full year of real-time AVM (Automatic Vehicle Monitoring) data and comparing it to the planned schedules in GTFS files. The Gini index serves as a measure of inequality, illustrating how evenly accessibility to amenities is distributed across a population.
Key Findings
The study found that discrepancies in accessibility metrics were significantly greater when real-time data was considered. This highlights the impact of unplanned disruptions such as delays, cancellations, and irregular service intervals, which are often invisible in GTFS-based studies. The findings strengthen the case for incorporating real-time data in accessibility analysis to provide a more accurate representation of the public transportation experience.
Next Steps in Research
Building on these insights, the team is planning a follow-up study to examine the theoretical variability of transport services in response to common disruptions, including labor strikes and natural hazards such as landslides. By simulating these events and analyzing their impact on accessibility, this research aims to better understand and plan for the resilience of public transit systems.
Implications
This body of work underscores the importance of integrating real-time data into urban planning and public transportation studies. It calls for a shift in how accessibility metrics are calculated and interpreted, particularly for policymakers and transit agencies aiming to improve equity and reliability in urban mobility systems.
Reference: https://www.sciencedirect.com/science/article/pii/S277242472400043X
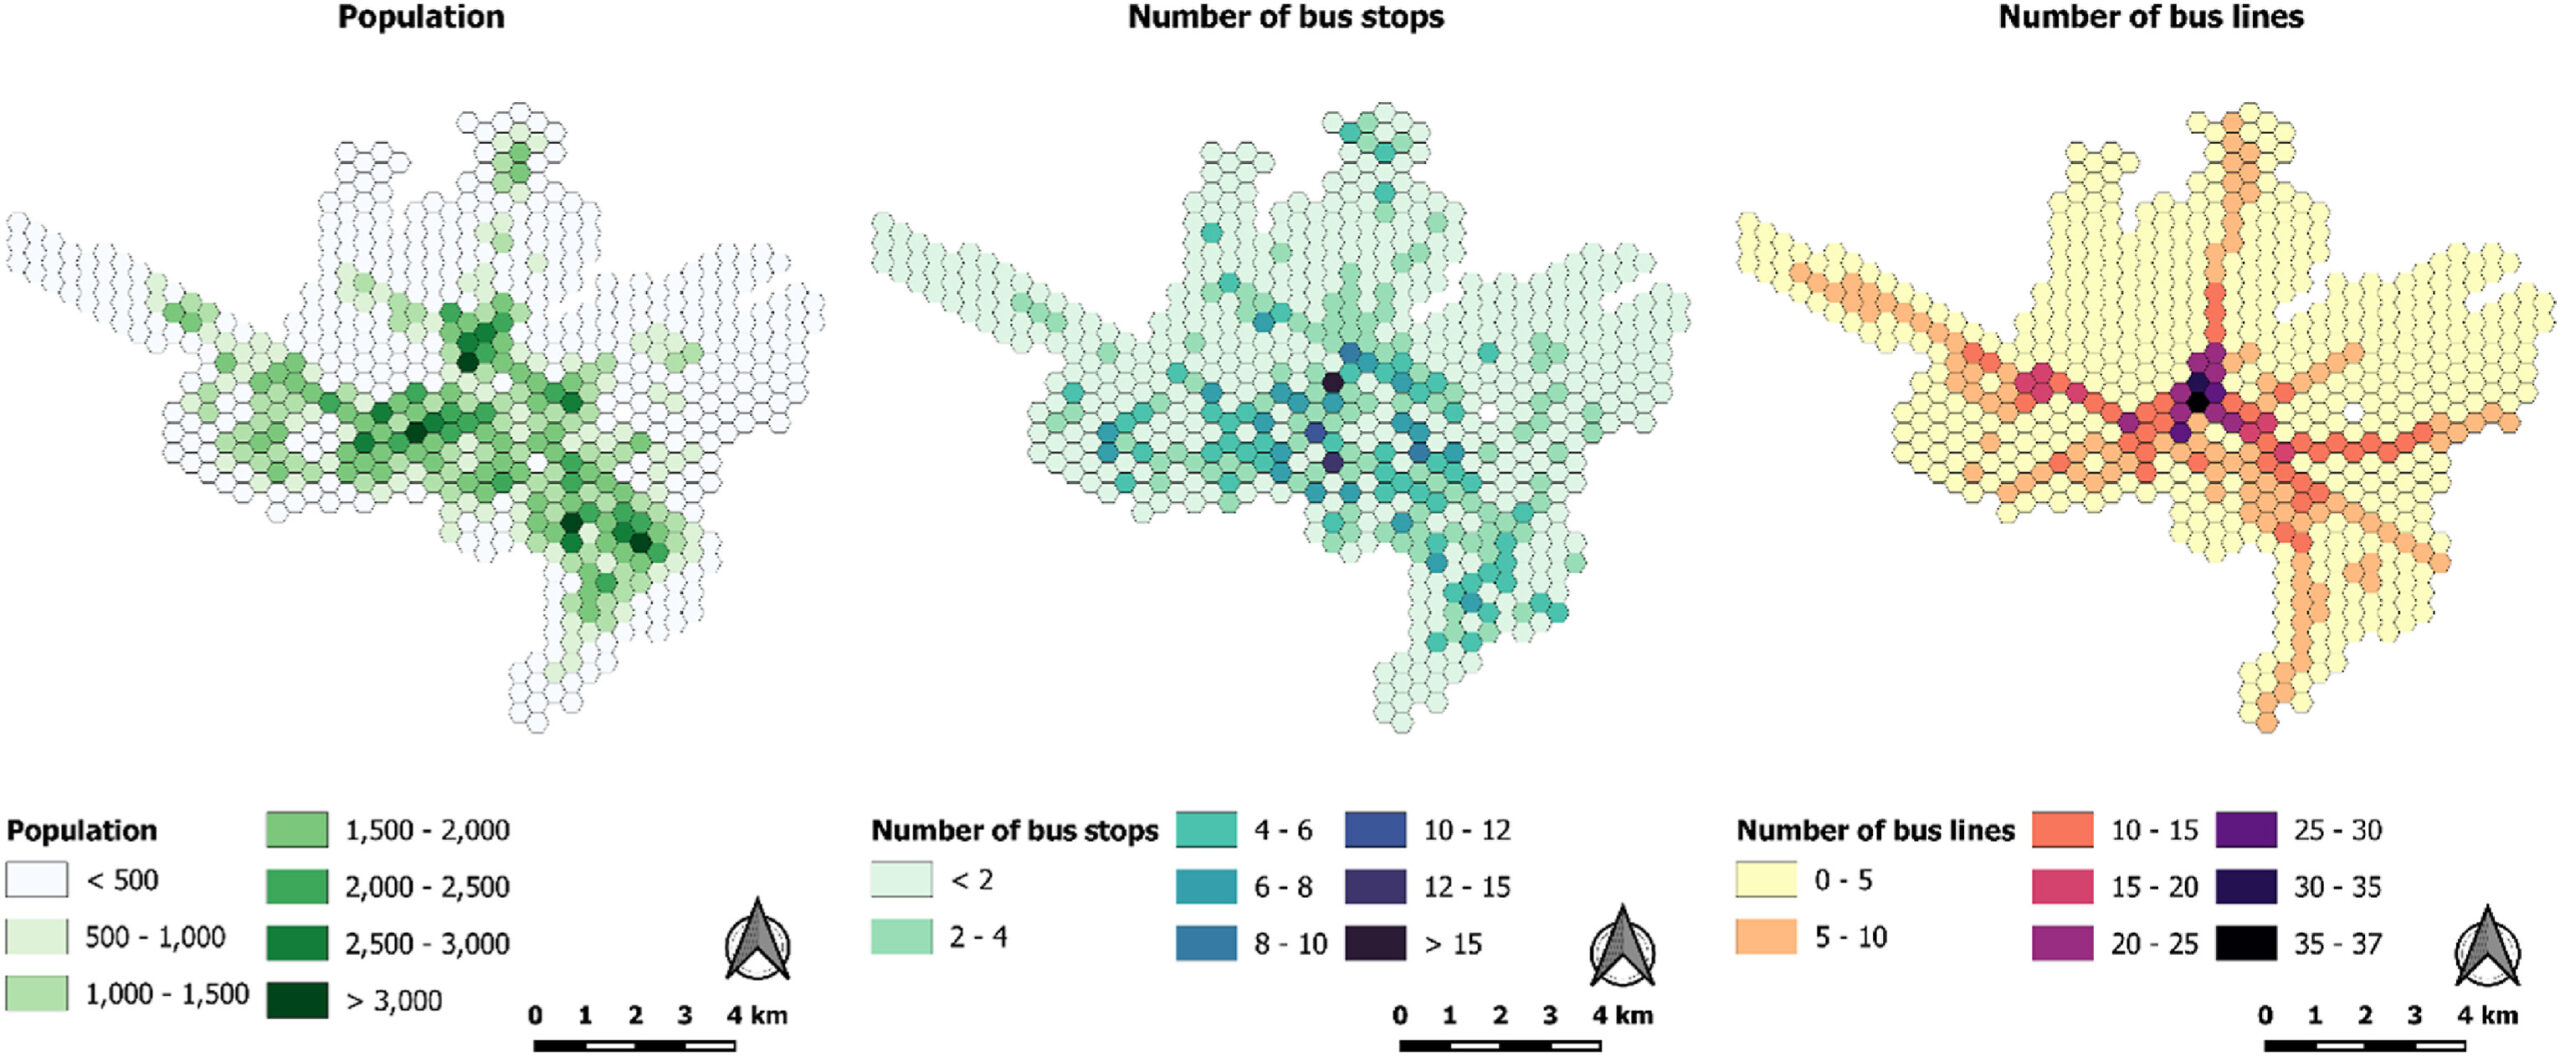
Title image: Population density and PT coverage. Own elaboration on the basis of Comune di Bologna (2024a) and TPER SpA (2023).


