

This research shows how spatial indicators from openrouteservice (ORS) can support building-level demographic predictions using machine learning. The study combines ORS APIs, building attributes, and POI data to estimate population and age characteristics in German cities, offering insights into the relationship between urban accessibility and demographic patterns.
In today’s data-driven world, understanding cities at a granular level is essential for making informed planning and policy decisions. Yet, traditional sources of demographic data—such as censuses and surveys—are infrequent, expensive, and often lack the spatial resolution needed for localized urban analysis.
A recent master’s thesis by Fatemeh Rafiei explores how machine learning techniques—specifically Random Forest (RF) and Extreme Gradient Boosting (XGBoost)—can be used to predict demographic characteristics at the building level. The study integrates a variety of open urban datasets and demonstrates how spatial indicators derived from openrouteservice (ORS) can enhance predictive modeling.
By combining building-level attributes with data on urban accessibility and proximity, the research aims to estimate key demographic variables such as total population, average age, and the proportion of residents under 18 and over 65. This approach offers an alternative to traditional methods, particularly in contexts where up-to-date or fine-grained demographic data is lacking.
The study builds on methodologies developed in other urban settings, such as the work of Szarka & Biljecki (2022) in Singapore, and adapts them to the German context. Models were trained using data from Stuttgart and tested on Dresden, allowing for an assessment of how transferable such approaches are across different urban environments.
Central to this work is the use of openrouteservice APIs to generate spatial features related to mobility and accessibility. These indicators contributed to models’ ability to predict demographic patterns at the micro level.
openrouteservice (ORS) APIs as indicators:
The Directions API from ORS was used to calculate walking distance and time from each residential building to the city center. These proximity data were added as input in the ML models to help improve predictions of population density, average age, and age group proportions at the building level. Access to the city center is an urban factor that can influence where people choose to live. For example, people who want to be close to services and amenities may prefer areas with shorter walking times to city centers.
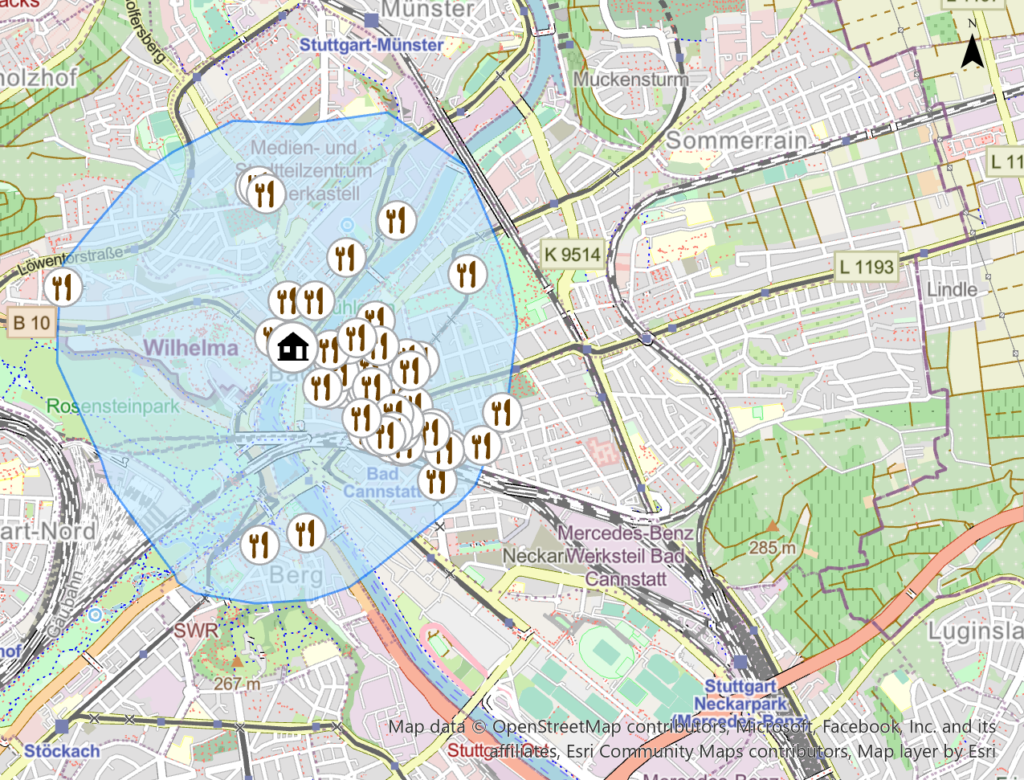
The Isochrones API from ORS was used to define 15-minute walking areas around each residential building. These areas were then used to assess the accessibility of different POI categories, based on OpenStreetMap (OSM) data. The count of POIs within each category in the 15-minute walking distance serves as key input indicators for demographic predictions. These indicators help models learn the relationship between accessibility and demographic characteristics. Areas with a higher variety of accessible POIs tend to attract larger, more diverse populations. For example, proximity to parks may make an area more appealing to families with children.
Data:
Building data: 2D building footprints provided by IÖR Dresden, derived from the 2022, 3D CityGML data of Germany’s Federal Agency for Cartography and Geodesy. Data includes structural details such as volume, height, area, perimeter and roof type.Demographic data: Sourced from the 2022 Census and provided by the Federal Statistical Office of Germany. Data includes population, average age, and age group proportions at the 100-meter grid level.POI data: Derived from OSM in 2024, including key-value pair attributes for different kinds of public services, such as schools, hospitals, and pharmacies.Block data: The Digital Landscape Model (DLM) of the German Topographic Cartographic Information System (ATKIS), provided by Germany’s Federal Agency for Cartography and Geodesy in 2022. The data includes the types of the blocks such as residential, industrial and mixed-use.
Conclusion:
The results of the machine learning models indicate that both walking distance and walking time to the city center were consistently ranked among the top 15 most important features out of 59 in both the Random Forest and XGBoost models. This underscores the significance of urban accessibility—captured through ORS indicators—in shaping where people live.
While Points of Interest (POI) data did not emerge as a strong predictor of overall population, certain POI categories were more influential in estimating age-related demographic characteristics. This suggests that POI data may be more effective in capturing variations in demographic composition—particularly in relation to age—rather than population size alone.
Interestingly, these findings differ from similar research conducted in Singapore , where more detailed real estate and property-level data were available.
Overall, the research highlights the potential of combining open spatial data, such as those provided by openrouteservice, with machine learning to estimate demographic variables at high spatial resolution—especially in data-scarce environments.
Reference:
Szarka N, Biljecki F (2022) Population estimation beyond counts—Inferring demographic characteristics. PLoS ONE 17(4): e0266484. Population estimation beyond counts—Inferring demographic characteristics