
OhsomeNow stats makes it possible to monitor contributions to OpenStreetMap (OSM) in real time. We developed this new dashboard as part of our long-term cooperation with the Humanitarian OpenStreetMap Team (HOT), an international organization dedicated to humanitarian action and community development through open mapping. This dashboard has replaced the Missing Maps Leaderboard with a comprehensive overview of how much mapping takes place at certain mapping events and campaigns. With version 1.0 we have introduced even more features, which we will take a look at now.
New features
1. Show OSM Data Topics: Users are now able to select up to eleven OSM Data Topics. Information about the Topics will be displayed in addition to the four given categories (Total Edits, Contributors, Δ Buildings and Δ km of Roads). Additionally, it is now possible to display area values (see Δ km2 of LULC).
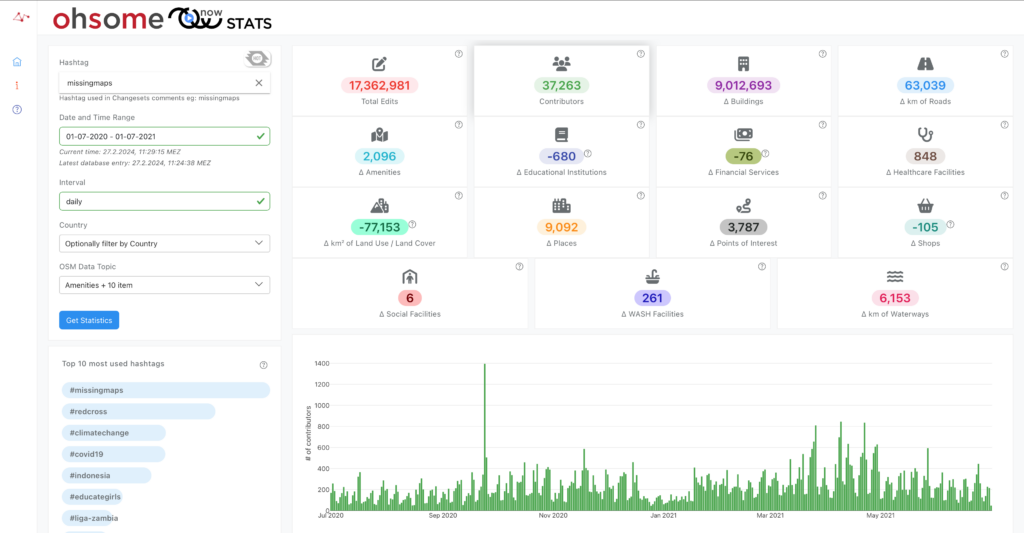
The updated ohsomeNow stats dashboard including all OSM Data Topics.
2. Live Mode for Mapathons: This feature allows users to monitor contributions to OpenStreetMap (OSM) in real time, especially during mapathons. Mapathons are events where volunteers come together to map features like roads, buildings or waterways on OpenStreetMap, often in response to specific needs or crises, e.g. after an earthquake or a flood. With the live mode, users can see updates minutely or even quicker on mapping progress, fostering a good spirit amongst the mappers. To activate the live mode select the time range “Last 3 hours” and the interval “five minutes”. When you are in the live mode a “LIVE” notification will appear in the top right corner of the page.
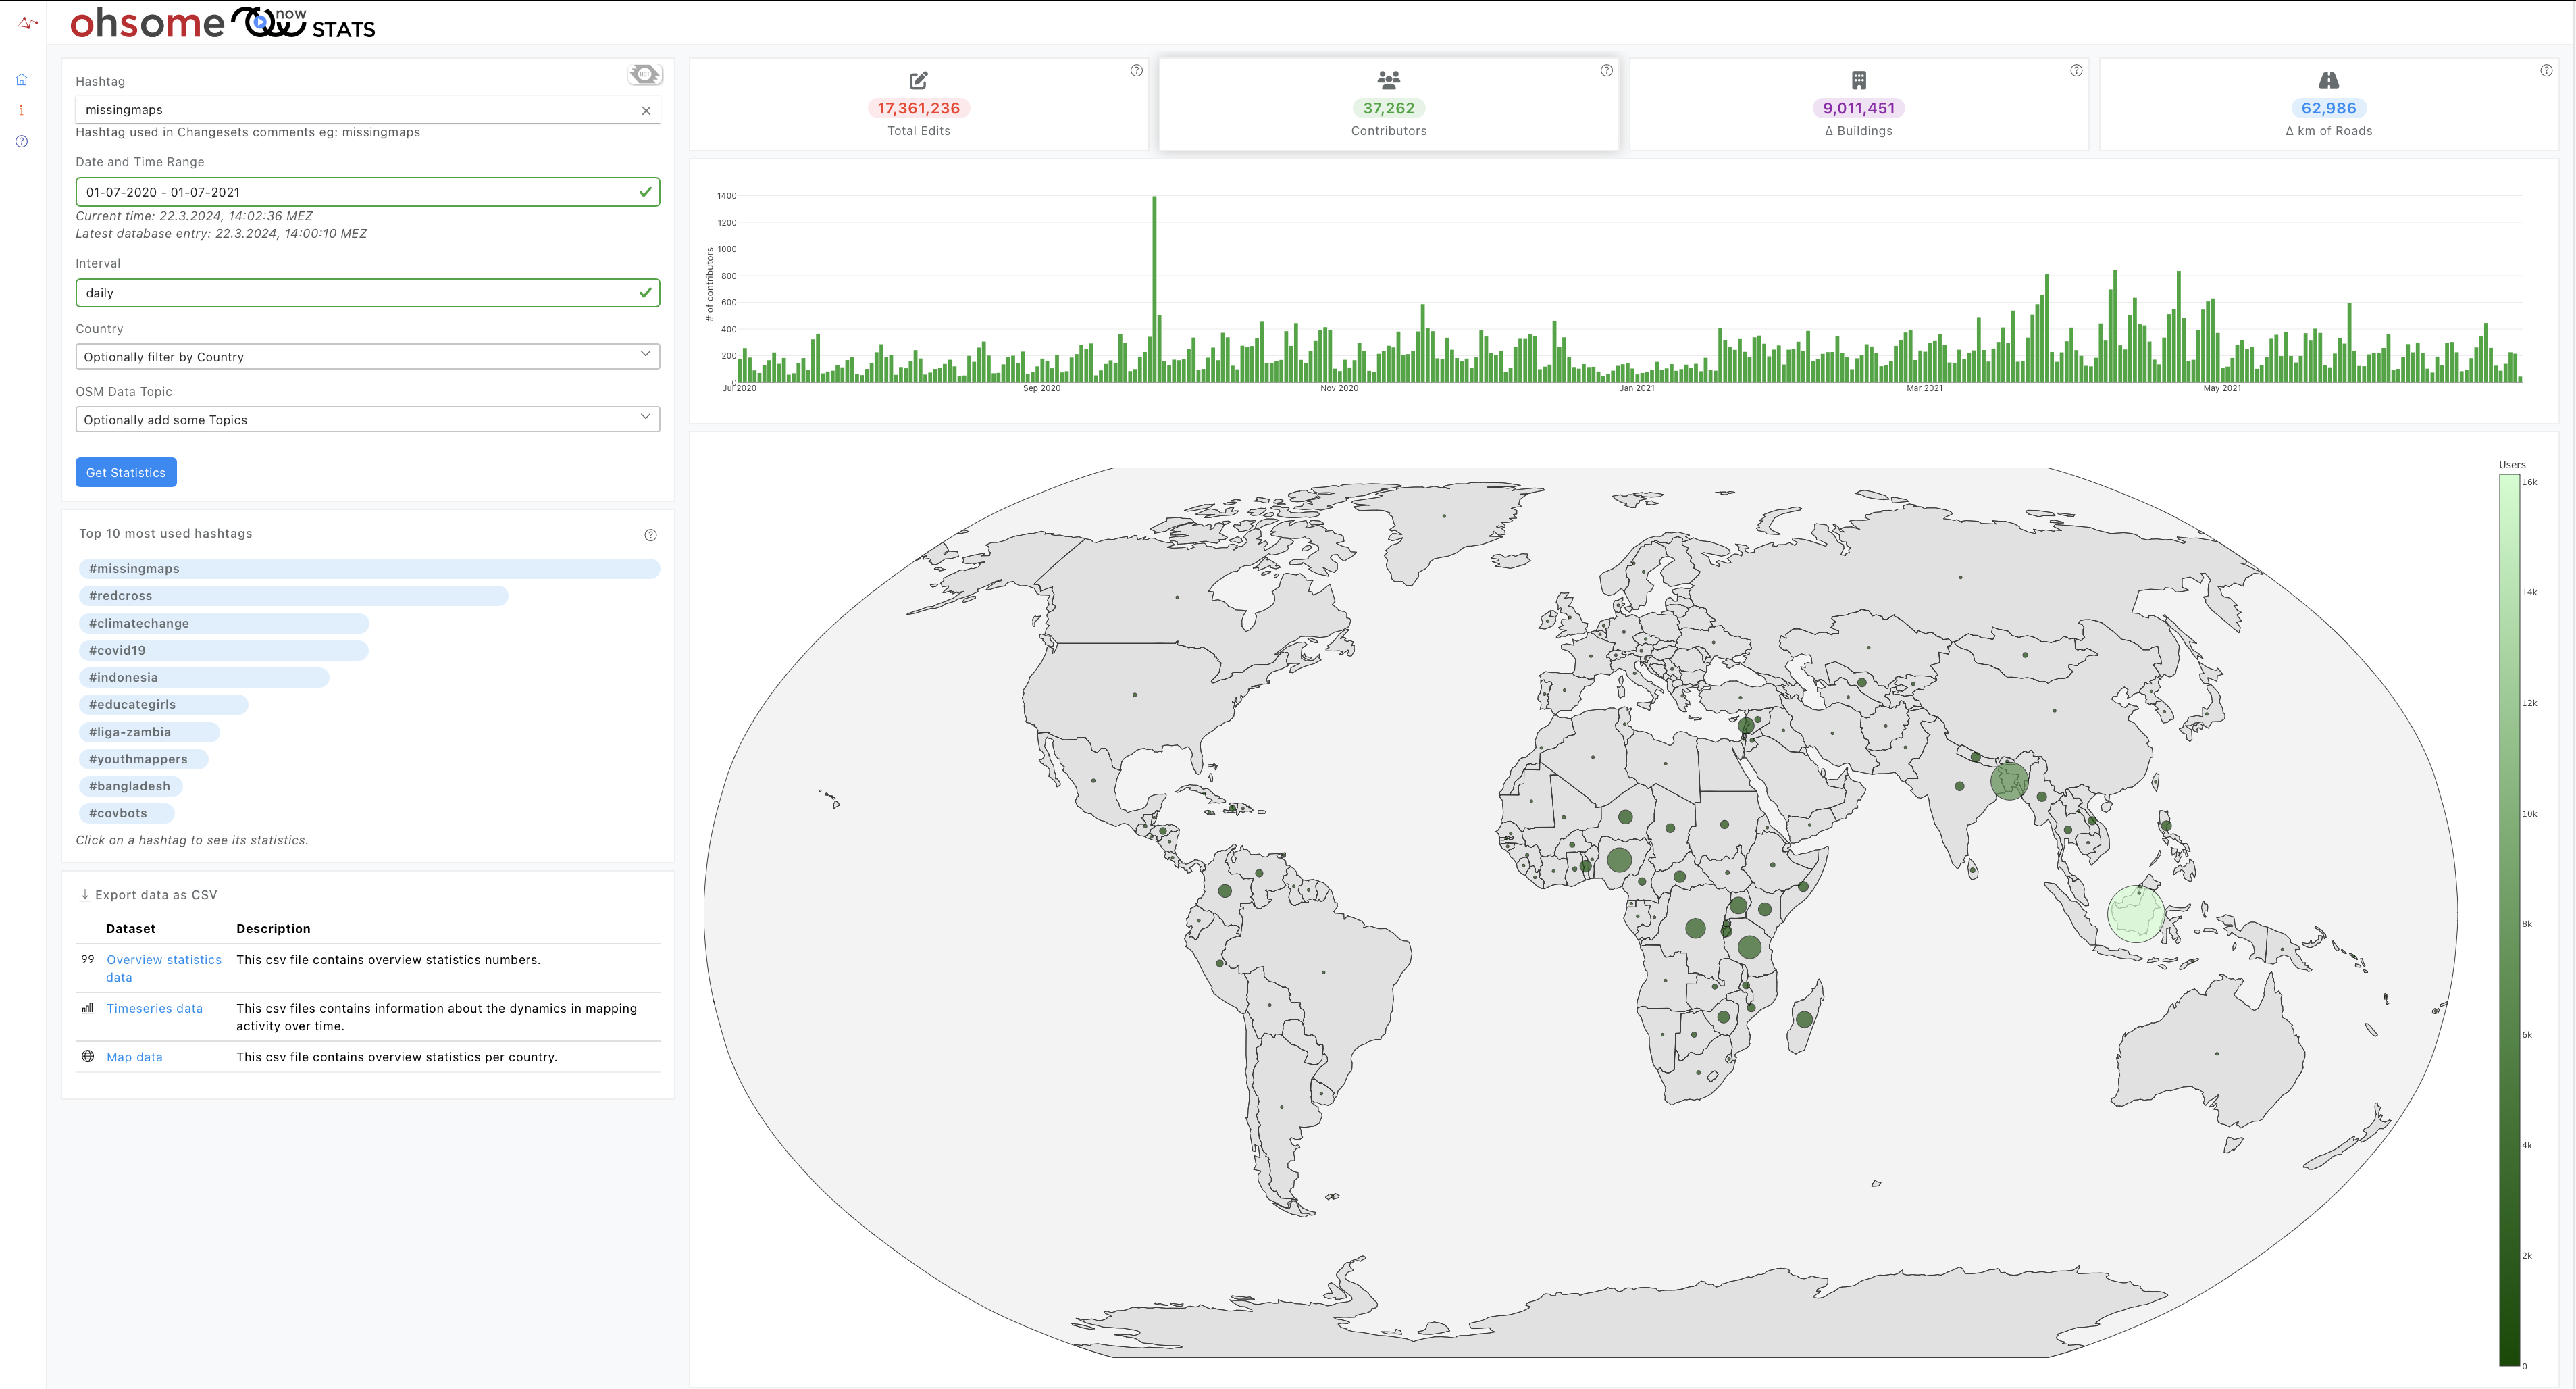
3. Hashtag Search: This feature enables users to search for specific hashtags related to mapping events and campaigns. Hashtags are commonly used in mapping projects to categorize the campaigns and enable data evaluation for each campaign. By incorporating the hashtag search functionality into the dashboard, users can easily find relevant information and insights related to ongoing mapping initiatives, enhancing their ability to stay informed and engaged. By default the top ten trending hashtags are displayed on the dashboard.
4. Data Download: Users now have the option to download the data behind our calculations and graphs in CSV format, to be able to generate individual analyses or replicate the dashboard features. This functionality provides greater transparency and flexibility, allowing users to further analyze the data, integrate it into their own workflows, or share it with others. By offering downloadable data, the dashboard also promotes open access to information and supports collaborative efforts within the OpenStreetMap community.
5. User specific time zones: The time zones are now being displayed according to the users location, allowing for an easier understanding of the graphs shown.
Check out all the new features in our showcasing video:
Overall, these new features enhance the functionality and usability of the ohsomeNow stats dashboard, empowering users to monitor mapping contributions, discover relevant content, and access data for further analysis and collaboration.
The Project
OhsomeNow stats has been developed by HeiGIT in cooperation with the Humanitarian OpenStreetMap Team (HOT). A global non-profit organization that harnesses the power of crowdsourced mapping through OpenStreetMap (OSM) for humanitarian response and community development. Collaborating with various partners, including HeiGIT, HOT facilitates mapping projects in areas affected by disasters and crises, providing vital geospatial data for humanitarian aid efforts. This shared project aims to improve the availability and accuracy of geographic information, supporting effective planning and coordination of relief efforts.
Beyond crisis response, HOT engages in community development initiatives, empowering local communities to utilize geospatial tools for urban planning, infrastructure development, and disaster risk reduction, ultimately fostering resilience and sustainable development worldwide.
Details and Contact
For a detailed explanation on how the data is analyzed and displayed please refer to our in-depth explanations in the help section of the website. For any inquiries please feel free to contact ohsome@heigit.org
To keep up with future developments and releases related to this project as well as other efforts to advance geospatial technology in the mobility, humanitarian aid, and data analytics space, follow the social media channels and stay up to date on our blog.