

Natural hazards threaten millions of people all over the world. To address this risk, exposure and vulnerability models with high resolution data are essential. However, in many areas of the world, exposure models are rather coarse and are aggregated over large areas. Although OpenStreetMap (OSM) offers great potential to assess risk at a detailed building-by-building level, the completeness of OSM building footprints is still heterogeneous. Therefore, in our recent paper we developed tools and methods to assess building completeness using a novel task type in the crowd sourcing app MapSwipe.
The paper is published in the IJGI by MDPI and available as “open access”:
Ullah, T.; Lautenbach, S.; Herfort, B.; Reinmuth, M.; Schorlemmer, D. Assessing Completeness of OpenStreetMap Building Footprints Using MapSwipe. ISPRS Int. J. Geo-Inf. 2023, 12, 143.
While a lot of resources and tools are in place to ease mapping in OSM, some learning effort is still needed for newcomers wanting to contribute. To ease that initial hurdle, the smartphone application MapSwipe has been designed as a tool that requires only a minimum training effort and that uses a simple and easy-to-learn user interface. The tool has been developed and is maintained by the Heidelberg Institute for Geoinformation Technology (HeiGIT) in cooperation with the British Red Cross (BRC), the Humanitarian OpenStreetMap Team (HOT), Médecins Sans Frontières (MSF) and volunteers. MapSwipe introduced the aspect of gamification to the detection of buildings by showing the user satellite imagery prompting for the selection of areas in which buildings can be identified by the user. Once these areas are marked, the~user swipes the satellite imagery aside to receive the next images—hence the name MapSwipe.
As part of the LOKI project we tested and developed a new project type for the mobile app MapSwipe that allows the assessment of the completeness of OSM buildings per tile. The completeness feature allows to classify a tile as “no building”, “complete” or “incomplete” by not tapping, tapping once or twice.
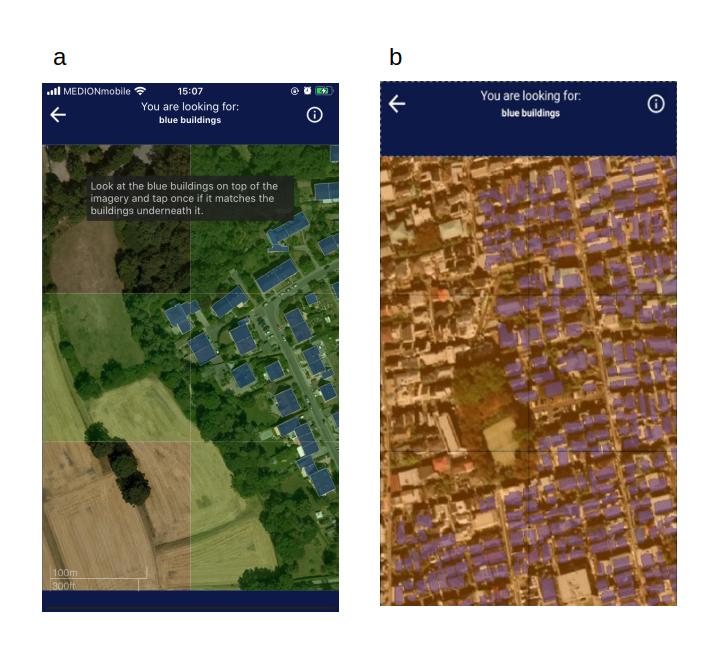
MapSwipe main screen. Two examples are given: a)Green-colored tiles represent complete tiles, untapped tiles represent no building tiles; b) Orange-colored tiles represent areas that are incompletely mapped in OSM with respect to building footprints.
The completeness feature was tested to four regions (in Medellin, Sirios, Taipei and Tokyo) and compared with two approaches: i) an intrinsic approach based on ohsome and the fitting of a saturation-curve and ii) with the prediction of a machine learning model developed at HeiGIT (Herfort et al. (2022)).
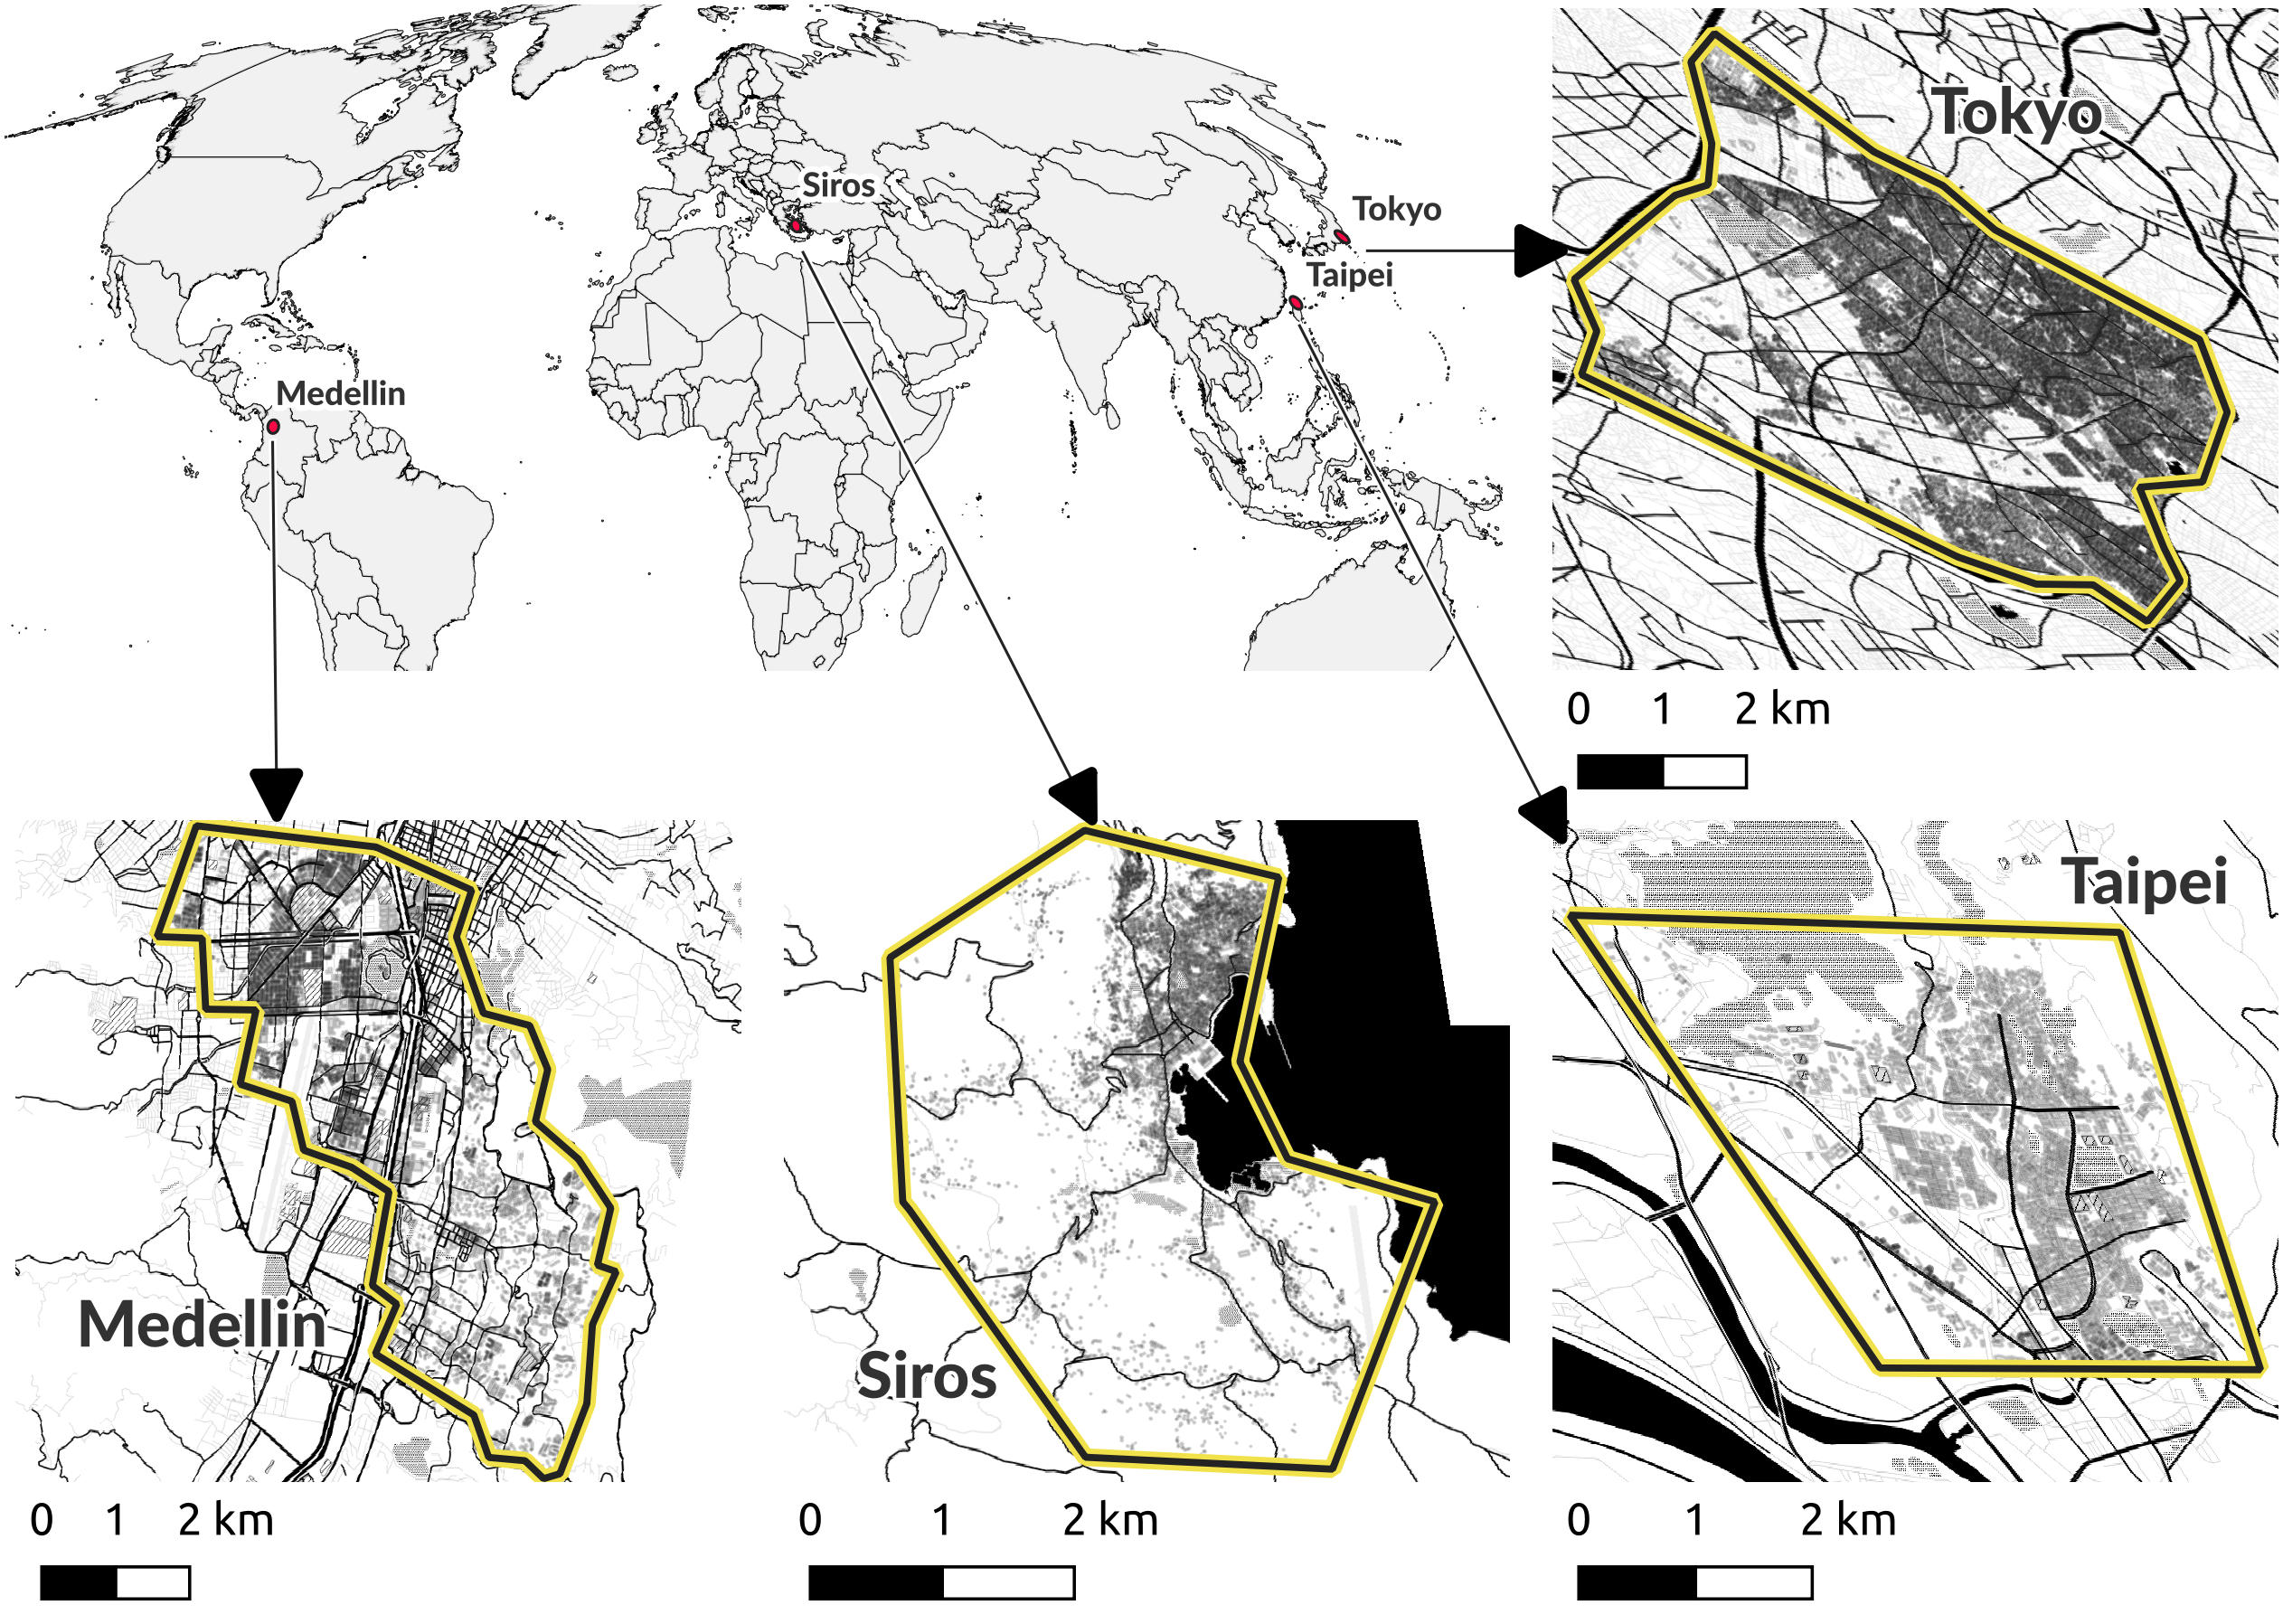
Case study locations. The completeness of mapping in OSM differed across and within the case studies. However, all four case studies contained a large number of OSM features as indicated by the detail maps which were limited for this figure to the most relevant features (main roads and building footprints). Data source: OpenStreetMap contributors under ODbL and Natural Earth (world map). Map tiles for detailed maps by Carto, under CC BY 3.0.
Our results show that the crowd-sourced approach yields a reasonable classification performance of the completeness of OSM building footprints. The MapSwipe-based assessment produced consistent estimates for the case study regions while the other two approaches showed a higher variability.
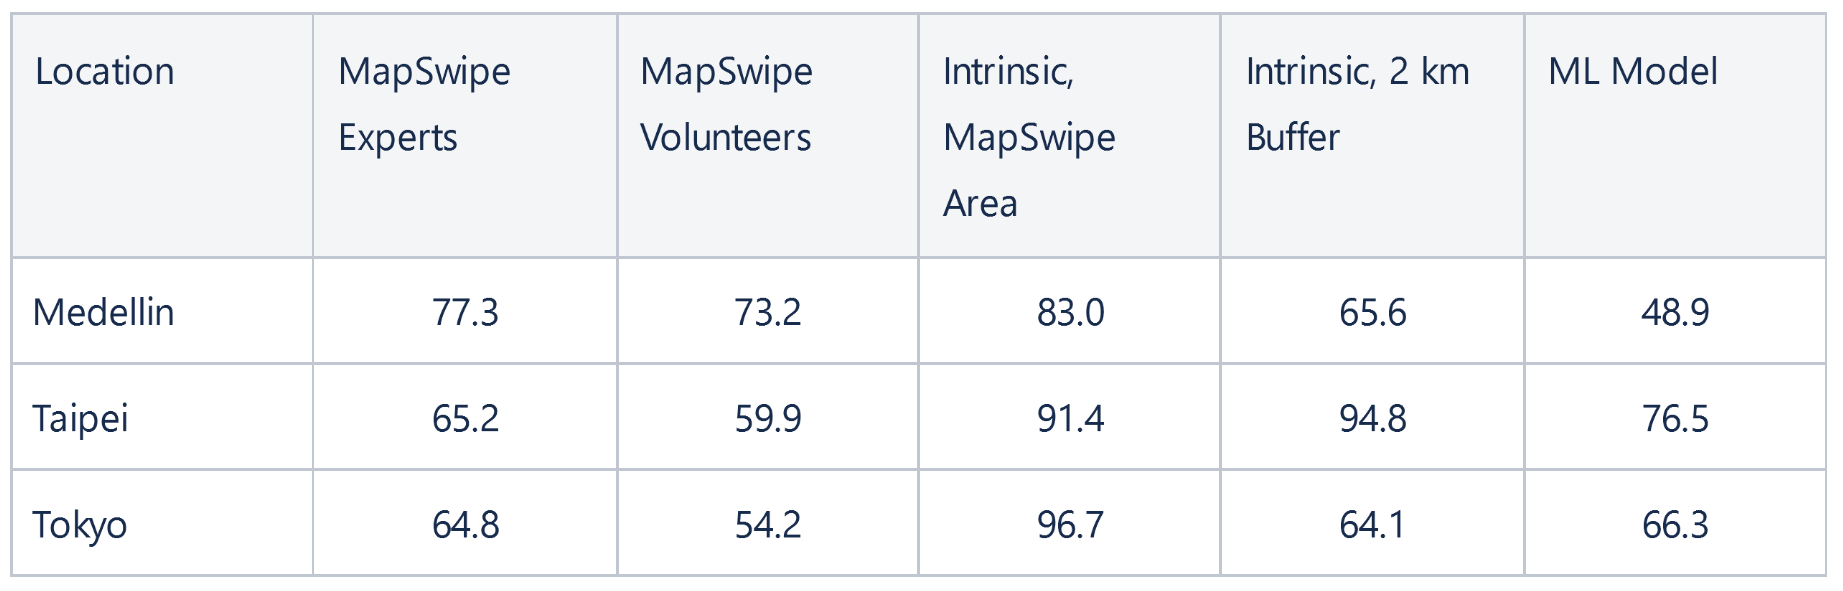
Comparison of MapSwipe completeness assessment with a saturation-curve fitting approach and the prediction of OSM buildings by a machine learning model by Herfort et al.(2022). All values are given as percentages. For MapSwipe, the values represent the share of cells that were flagged as incomplete by volunteers or by experts. The expert judgement can be interpreted as the ground truth for September 2020. Tiles without buildings were not incorporated in the calculation. For the intrinsic approach, the comparison was made by relating the fitted asymptote of the saturation curve with the observed count for September 2020. For the machine learning model, the comparison is made between number of buildings observed at the date of the analysis and the predicted building footprints by the model. Both approaches used for comparison were not applicable for Sirios.
Our study also revealed factors influencing the quality of the MapSwipe assessment. Volunteers tended to classify nearly completely mapped tiles as “complete”, especially in areas with a high OSM building density. Another factor that influenced the classification performance was the level of alignment of the OSM layer with the satellite imagery.
The results demonstrate that the completeness feature for MapSwipe provides a good opportunity for the fast assessment of OSM building completeness at smaller scales, as is often required in a disaster setting. The aggregation of feedback by the different users provided reliable estimates of completeness for the selected task. The tool complements other approaches to estimate OSM feature completeness in a region. It allowed to identify parts of an affected region that require more mapping of buildings at high spatial resolution. Intrinsic approaches, in contrast, require larger regions for reliable assessments as they work by integrating mapping history over time and space. If predictions by models such as the one used here are available, they might offer a good alternative as well. However, as long as these are not available for a required feature class, a combination of regional-scale assessment of intrinsic approaches and detailed evaluation by volunteers using the tool presented here can combine the best of both worlds to quickly assess data quality, which is often necessary in disaster contexts. For building footprints, a combination of all three presented approaches might be a suitable solution to obtain a timely estimation about where additional mapping effort is needed.
Details can be found in the paper: Assessing Completeness of OpenStreetMap Building Footprints Using MapSwipe.