Inspection and analysis of geo-tagged shipping information could provide insights to the transformation of a variety of “global spaces” during times of rapid globalization. One of the famous resources of shipping data is a shipping newspaper called LLOYDS lists. The list contains weekly and later daily information on global shipping since the late seventeenth century and are therefore of interest to historical studies.
Within the LLOYDS lists project, it is aimed to develop a web-based GIS for online inspection and statistical analysis of two important data categories of LLOYDS dataset, namely: “Intelligence” and “Speakings” information. The speakings capture information regarding occurred exchanges of goods and/or people in certain locations in the sea between ships. Since this information provides geographical coordinates of the occurrences, it is interesting to perform statistical clustering in order to understand the potential patterns of the dataset. This would later allow to compare the patterns with shipping routes and in the case of differences would raise research questions for historians. As an example, one could be interested to understand why certain hot spots of speakings have occurred in a given region, how this has changed over time and what could have influenced this change?
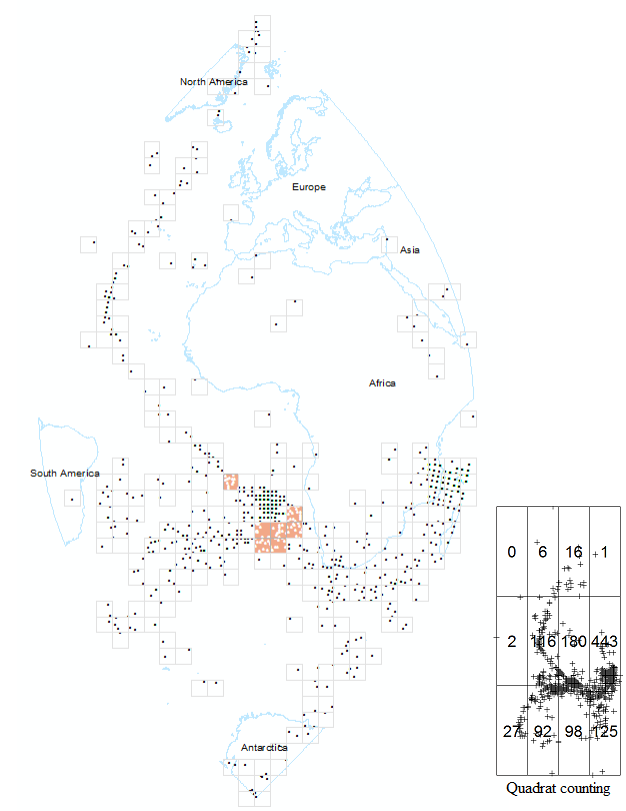
Figure below shows an example of spatial clustering and quadrat counting for a sample of speakings information for the period of three months (Jan-March), 1851. Looking at the figures, the initial results that comes in mind are the higher density of speakings in South Africa (both east and west) compared to other regions, as well as that there have been no trade happened near UK (at least in this time period) or as our project partner colleague Dr. Kilian Schultes states: the speakings information for that region might have not been recorded and/or published in the LLOYDS newspaper, making it an interesting question for historians to research and address the possible reasons for this.
This operating project is being done in GIScience research group along with partners of the cluster of excellence Asia and Europe in a global context and HGIS club (Histoic-GIS club) at Heidelberg University. More information and results of this project would be provided in the future. Stay tuned!