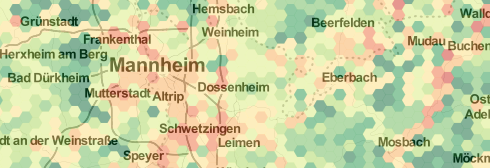
In 2011 we released OSMatrix — a web-based application to visualize characteristics of OpenStreetMap, which are usually not displayed in cartographic representations of the data. The characteristics include information on the topicality of data, user contributions and the presence (or absence) of certain feature types. As we have demonstrated before, these characteristics enforce understanding of data quality and activities in the community.
Today we present a new release of OSMatrix including completely re-designed and re-implemented client- and server-side components as well as a multitude of temporal information on the characteristics.
In particular, new features include:
- Completely re-designed and re-implemented client application: The client leverages latest technologies, such as HTML5 and CSS3, which improves the performance of the application and reduces its internal complexity and resulting in a decrease of the final file size from 137KB to only 20KB.
- Completely re-implemented server-side components: NodeJS has been used as the core technology, which provided flexibility to implement implement a custom HTTP interface and further allowed us to apply Mapnik for visualization purposes. This led to tremendous performance boosts, when compared to Geoserver, which we used before.
- New data: We had our machines running day and night to process data. OSMatrix now provides information on the temporal evolution of the characteristics at half-year intervals, beginning in July 2009. The evolution can be visualized using graphs for selected areas by clicking on the map or by viewing comparison maps of two selected points in time.
Please try the new client application and let us know what you think. Further, help us improve OSMatrix by reporting issues on Github or get in touch with us via e-mail or Twitter.
OSMatrix has been brought to life by Lukas Loos and Oliver Roick at GIScience Research Group at Heidelberg University.


Leave a Reply
You must be logged in to post a comment.